Background information
In 1989, the Montreal Protocol on Substances that Deplete the Ozone Layer entered into force. Its objective is to protect the stratospheric ozone layer by phasing out the production of ozone-depleting substances (ODS). The protocol covers over 200 individual substances with a high ozone-depleting potential (ODP), including chlorofluorocarbons (CFCs), halons, carbon tetrachloride (CTC), 1,1,1-trichloroethane (TCA), hydrochlorofluorocarbons (HCFCs), hydrobromofluorocarbons (HBFCs), bromochloromethane (BCM) and methyl bromide (MB), all of which are referred to as ‘controlled substances’.
Within the European Union (EU), the use of and trade in substances is regulated by Regulation (EC) No 1005/2009 (known as the Ozone Regulation). This regulation stipulates that all companies producing controlled substances or importing them into and/or exporting them out of the EU, as well as feedstock users, process agent users and destruction facilities, must report their activities concerning controlled substances annually. The Ozone Regulation also encompasses five additional ODS that are not covered by the Montreal Protocol. These ‘new substances’ are halon 1202, methyl chloride (MC), ethyl bromide (EB), trifluoroiodomethane (TFIM) andn-propyl bromide (n-PB). Producers, importers and exporters also have to report their activities for these new substances.
The European Environment Agency (EEA) is responsible for collecting, archiving, checking and aggregating information contained in these company reports. The EEA also supports the companies in fulfilling their reporting obligations. The data reported on production, imports and exports are presented to parties of the Montreal Protocol, in order to monitor progress in phasing out ODS in compliance with the Protocol. In 2020, 235 companies reported on their 2019 activities under the Ozone Regulation.
The EU has already achieved its phase-out goals under the Montreal Protocol and reports on the uses that are still allowed.
This briefing summarises the most recent data reported by companies under the Ozone Regulation and looks at trends since 2006. Data from 2012 onwards were also updated, based on reports resubmitted after the reporting deadlines for these years. Figures and data tables can be accessed in an online viewer.
Since the potential to harm the ozone layer varies among substances, results are expressed in both metric tonnes and ODP tonnes. The observed trends can differ significantly depending on the unit used. Controlled substances with a relatively high ODP (e.g. CFCs and CTC) exhibit a different trend from those with a relatively low ODP (e.g. HCFCs).
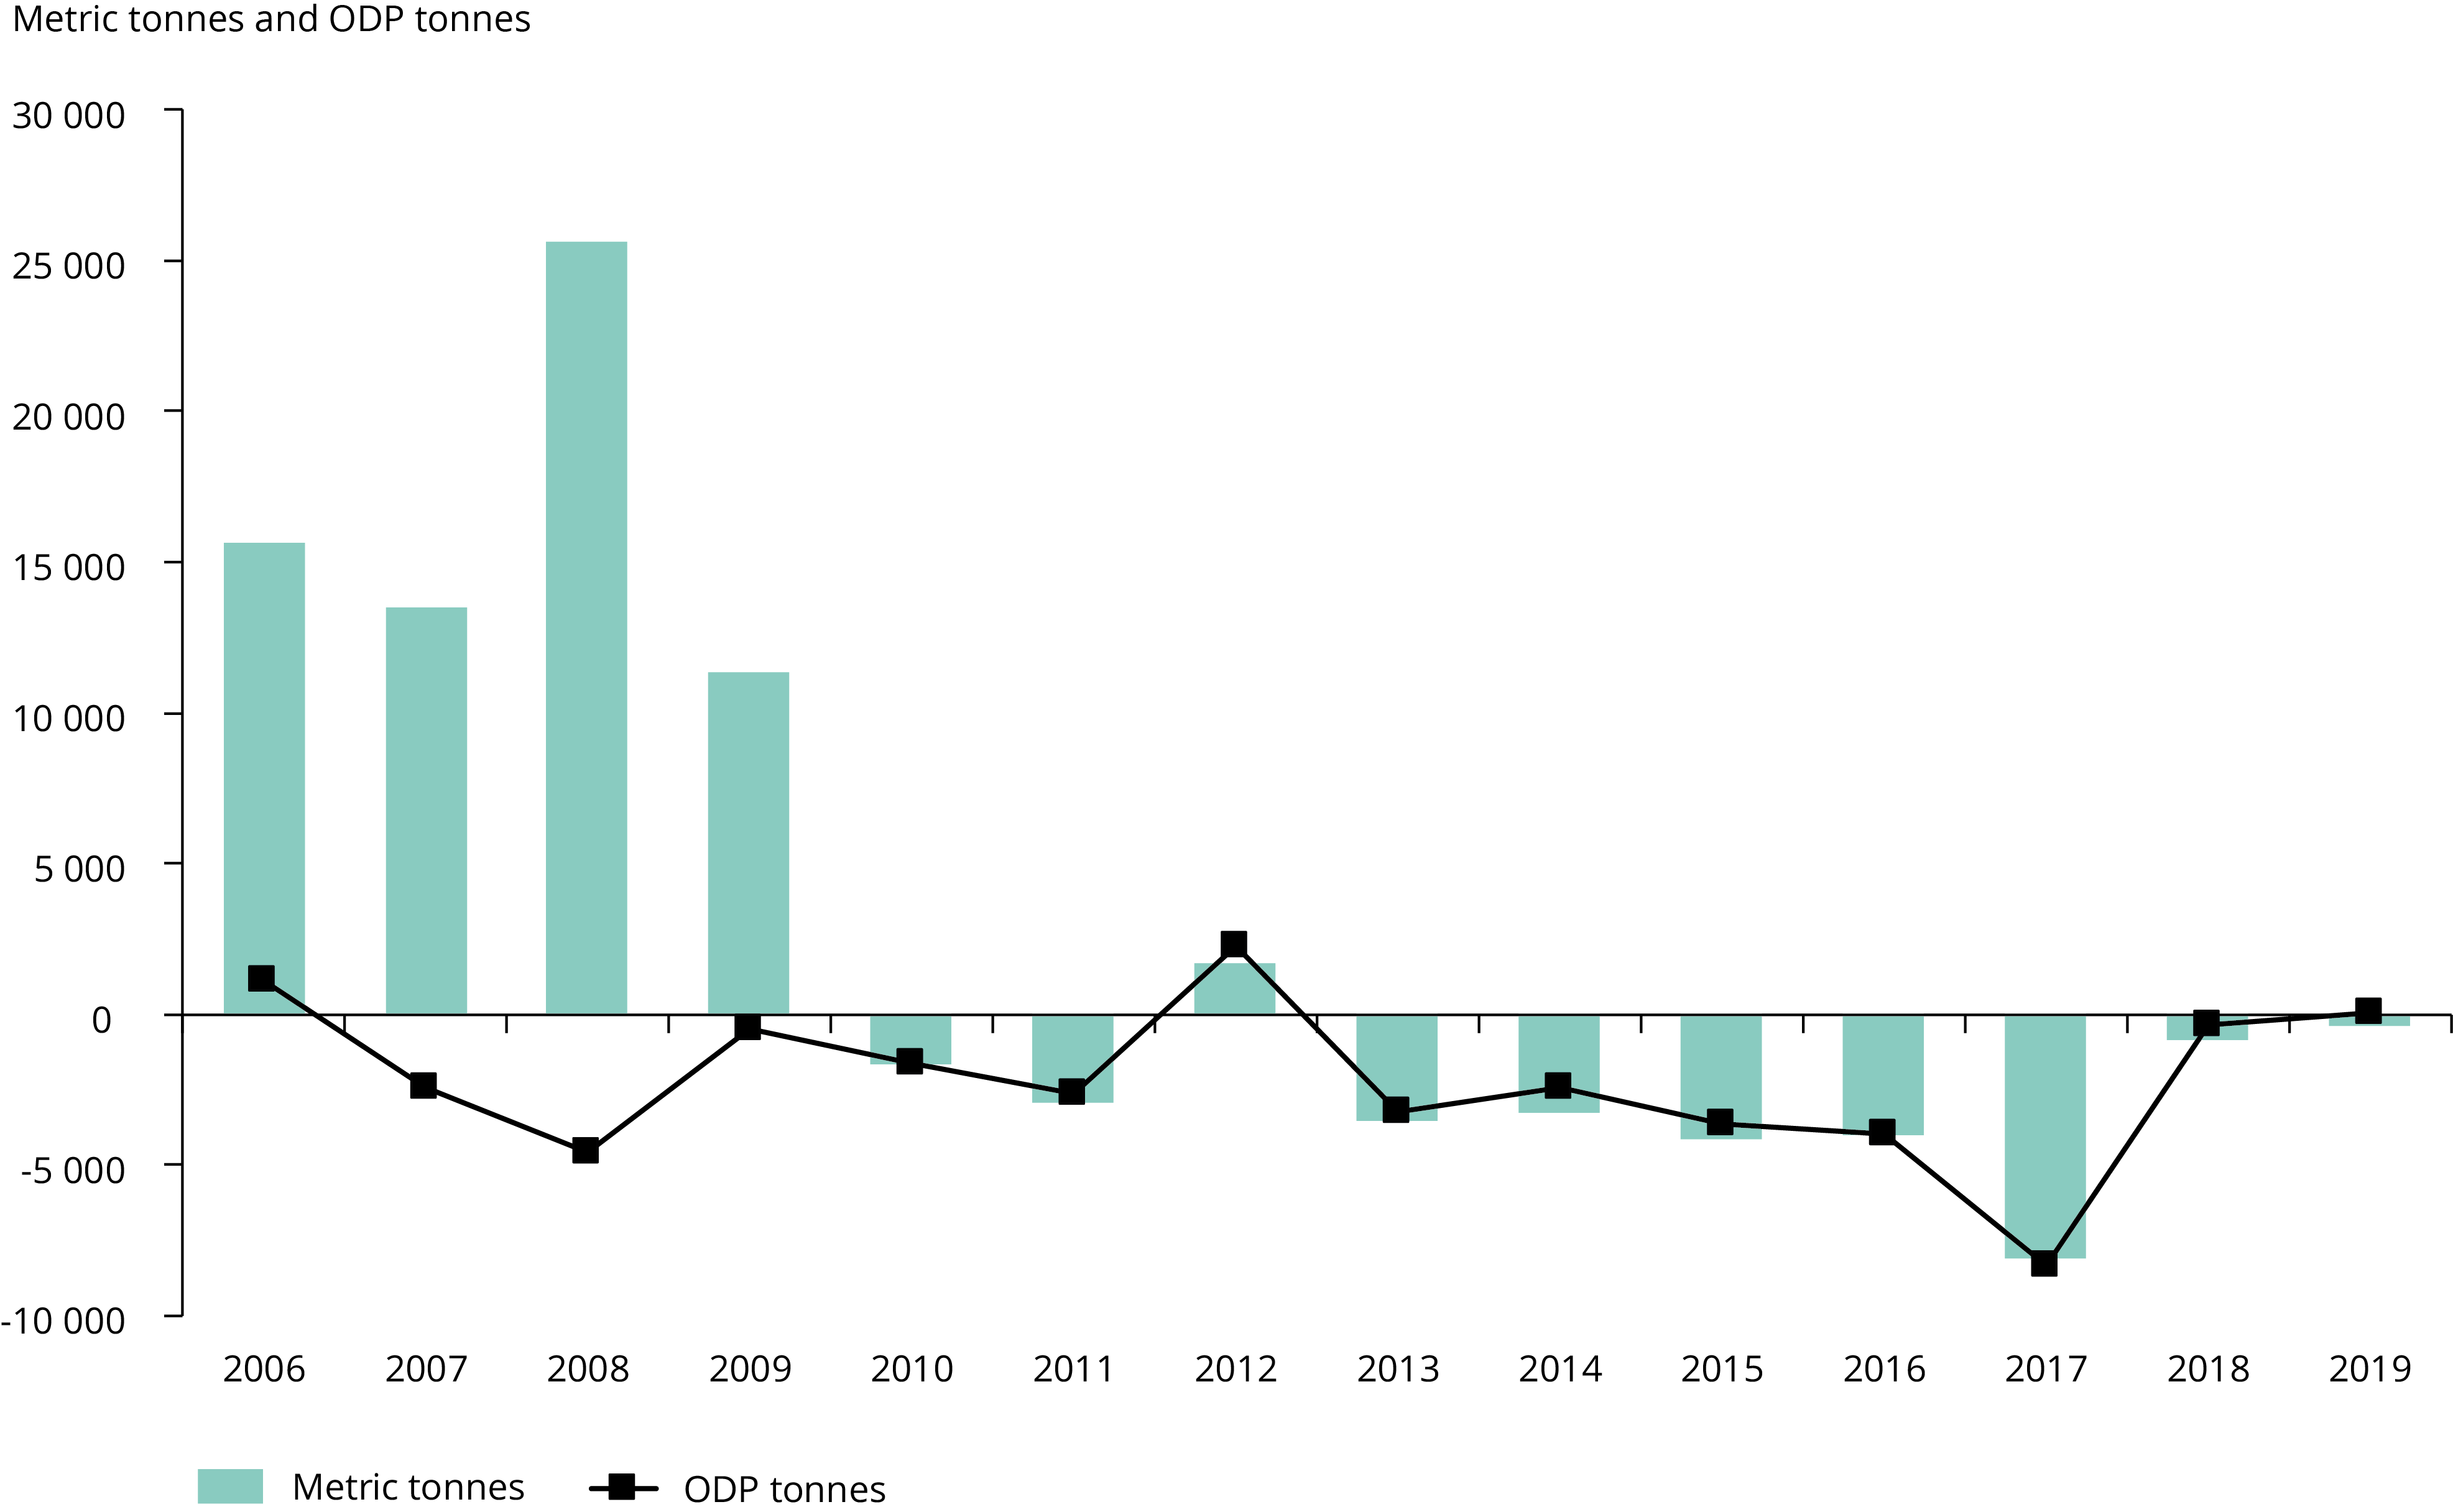
Consumption of controlled substances
Consumption is an aggregated parameter calculated for data reported under the Montreal Protocol (see Box 1 below). It integrates the statistics on imports, exports, production and destruction of controlled substances into one single metric, excluding non-virgin imports and exports. Amounts that are produced and imported for feedstock use within the EU and process agent use are not included in consumption figures, in line with calculations applied under the Montreal Protocol. New substances listed in Annex II to the Ozone Regulation are also excluded from consumption data.
Box 1. Consumption
In brief, consumption (which only applies to controlled substances) is calculated as follows:
CONSUMPTION = ADJUSTED PRODUCTION + ADJUSTED IMPORT - EXPORT - DESTRUCTION
with
• ADJUSTED PRODUCTION = total production - production for feedstock in the EU - production for process agent use
• ADJUSTED IMPORT = total virgin imports - virgin imports for feedstock use in the EU - virgin imports for process agent use
• EXPORT = total virgin exports
• DESTRUCTION = total virgin and non-virgin destruction
In 2019, the consumption of controlled substances amounted to -387 metric tonnes, up from -884 metric tonnes in 2018. The consumption of controlled substances, when expressed in metric tonnes, has been negative every year since 2012. However, expressed in ODP, consumption in 2019 was positive for the first time since 2012, amounting to 61 ODP tonnes. The reason for the higher consumption in 2019, compared with previous years, is because of increased stocks in 2019 for the purpose of destruction in the future. Regarding consumption, imported and produced quantities should ideally be equal to or lower than exported and destroyed quantities. However, stocks held at the end of a year, which are to be destroyed in the following years, are not accounted for in consumption calculations.
Notes: The calculation of the consumption of controlled substances under the Montreal Protocol excludes non-virgin imports and exports, substances intended for feedstock and process agent use, as well as new substances (see box in text).
The withdrawal of the United Kingdom from the European Union on 31 January 2020 did not affect the production of this briefing, which refers to 2019 data. Data reported by companies from the United Kingdom are included in all analyses contained herein, unless otherwise indicated.
Sources: Data reported by companies to the European Environment Agency (EEA) under Article 27 of Regulation (EC) No 1005/2009 (EU Ozone Regulation).
Feedstock use of controlled substances
A number of ODS serve as feedstock for the manufacture of other products such as refrigerants, foam blowing agents, polymers, pharmaceuticals and agricultural chemicals. In 2019, feedstock use amounted to 159 157 metric tonnes, a 9 % decrease compared with 2018.
In 2019, the emission rate [1] from feedstock uses was 0.03 %. The 2019 average emission rate was comparable to the emission rate in 2018 and much lower than the emission rate for earlier years. This appears to point towards improvements in emission control by industry.
Process agent use of controlled substances
A process agent is a substance that either facilitates or inhibits a chemical reaction in an industrial process. In 2019, make-up [2] and emissions stayed well below restrictions imposed by both the Montreal Protocol and the Ozone Regulation.
Imports of controlled substances
In 2019, imports of controlled virgin substances into the EU amounted to 4 659 metric tonnes, which represents a 47 % decrease compared with 2018. This was the largest decrease observed since 2006 and the lowest ever recorded value. The imported controlled substances were almost entirely virgin substances and 77 % of them were imported from China. Slightly more than half of the imported virgin quantities were HCFCs, followed by CFCs. In contrast to previous years, CTC imports almost ceased in 2019. Controlled substances were mostly imported for feedstock use. Imports of controlled non virgin substances amounted to 1 % of total imports. Expressed in ODP tonnes, imports of virgin halons and CFCs were largest.
Exports of controlled substances
In 2019, exports of controlled virgin substances from the EU amounted to 18 799 metric tonnes, an increase of 83 % compared with 2018. CTC accounted for the largest quantities of exported virgin substances, followed by HCFCs. CTC was mainly exported for feedstock use outside the EU (59 % of total exports) and HCFCs mostly for feedstock use and refrigeration. Since almost no CTC was imported in 2019, the exported quantities were mainly produced in the EU or taken from stocks accumulated in previous years. As with imports, controlled non-virgin substances were exported out of the EU to a much lesser extent than controlled virgin substances, amounting to about 2 % of total exports when expressed in metric tonnes. Expressed in ODP tonnes, exports of virgin CTC were largest.
Production of controlled substances
In 2019, the production of controlled substances in the EU amounted to 178 316 metric tonnes, a 5 % decrease compared with 2018. This included mostly HCFCs, CTC and TCA. Only minor quantities of halons, HBFCs and BCM, and no CFCs or MB, were produced. Expressed in ODP tonnes, production of CTC and HCFCs was largest (79 % and 11 % of total production, respectively). Controlled substances were produced largely for feedstock use inside the EU (85 % of the produced quantity in metric tonnes). Production for feedstock use inside the EU decreased by 12 % in 2019 compared with 2018, while production for process agent use remained relatively constant. However, production for other uses, as accounted for in the estimation of the consumption of controlled substances (see Box 1 above and the section on consumption), increased by 44 % in 2019 compared with 2018. This was mainly because the production of HCFCs, but especially of CTC for feedstock use outside the EU, increased.
Destruction of controlled substances
In 2019, 8 347 metric tonnes of controlled substances were destroyed in total, an 10 % decrease compared with 2018. The largest quantities destroyed were of CTC, HCFCs and CFCs (77 %, 11 % and 10 % of total destruction, respectively). Expressed in ODP, of the 8 043 ODP tonnes, the largest quantities destroyed were of CTC and CFCs (88 % and 10 % of total destruction, respectively).
New substances
The Ozone Regulation is more stringent than the rules of the Montreal Protocol and encompasses new substances (halon 1202, n-PB, EB, TFIM and MC). In 2019, the production of new substances amounted to 1 002 611 metric tonnes, an 11 % decrease compared with 2018. The production of new substances was almost exclusively for feedstock use and predominantly comprised MC (99.5 % of total production), n-PB and EB. Expressed in ODP tonnes, the production of MC was also largest (97 % of total production).
In 2019, the production of new substances was almost six times higher than the production of controlled substances expressed in metric tonnes. However, when expressed in ODP tonnes, the production of new substances was almost three times lower than that of controlled substances in the same year. This is because new substances, on average, have a significantly lower ODP than controlled substances.

Document Actions
Share with others