next
previous
items

Figure

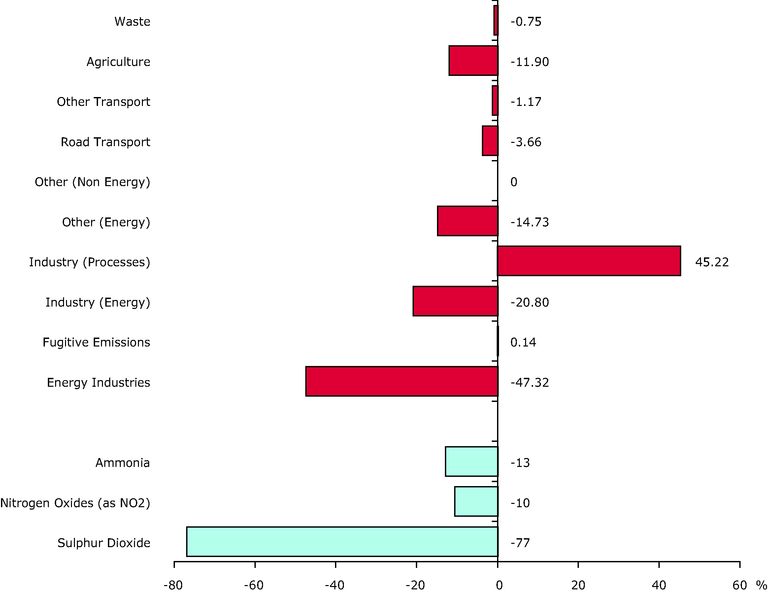
Contribution to total change in acidifying pollutant emissions for each sector and pollutant (EU-27 - EU-15).

Figure Created 12 Nov 2009 Published 12 Nov 2009 Last modified 29 Nov 2012
1 min read
Contribution to change plots show the contribution to the total emission change between 1990-2005 made by a specified sector/ pollutant

Download

European data

Metadata

Additional information

A negative value (-51%) indicates that this sector contributes to the total reduction in emissions of acidifying substances (by 51%). A positive value indicates an increase in emission in this sector and a negative impact on the total reduction in emissions.

Document Actions