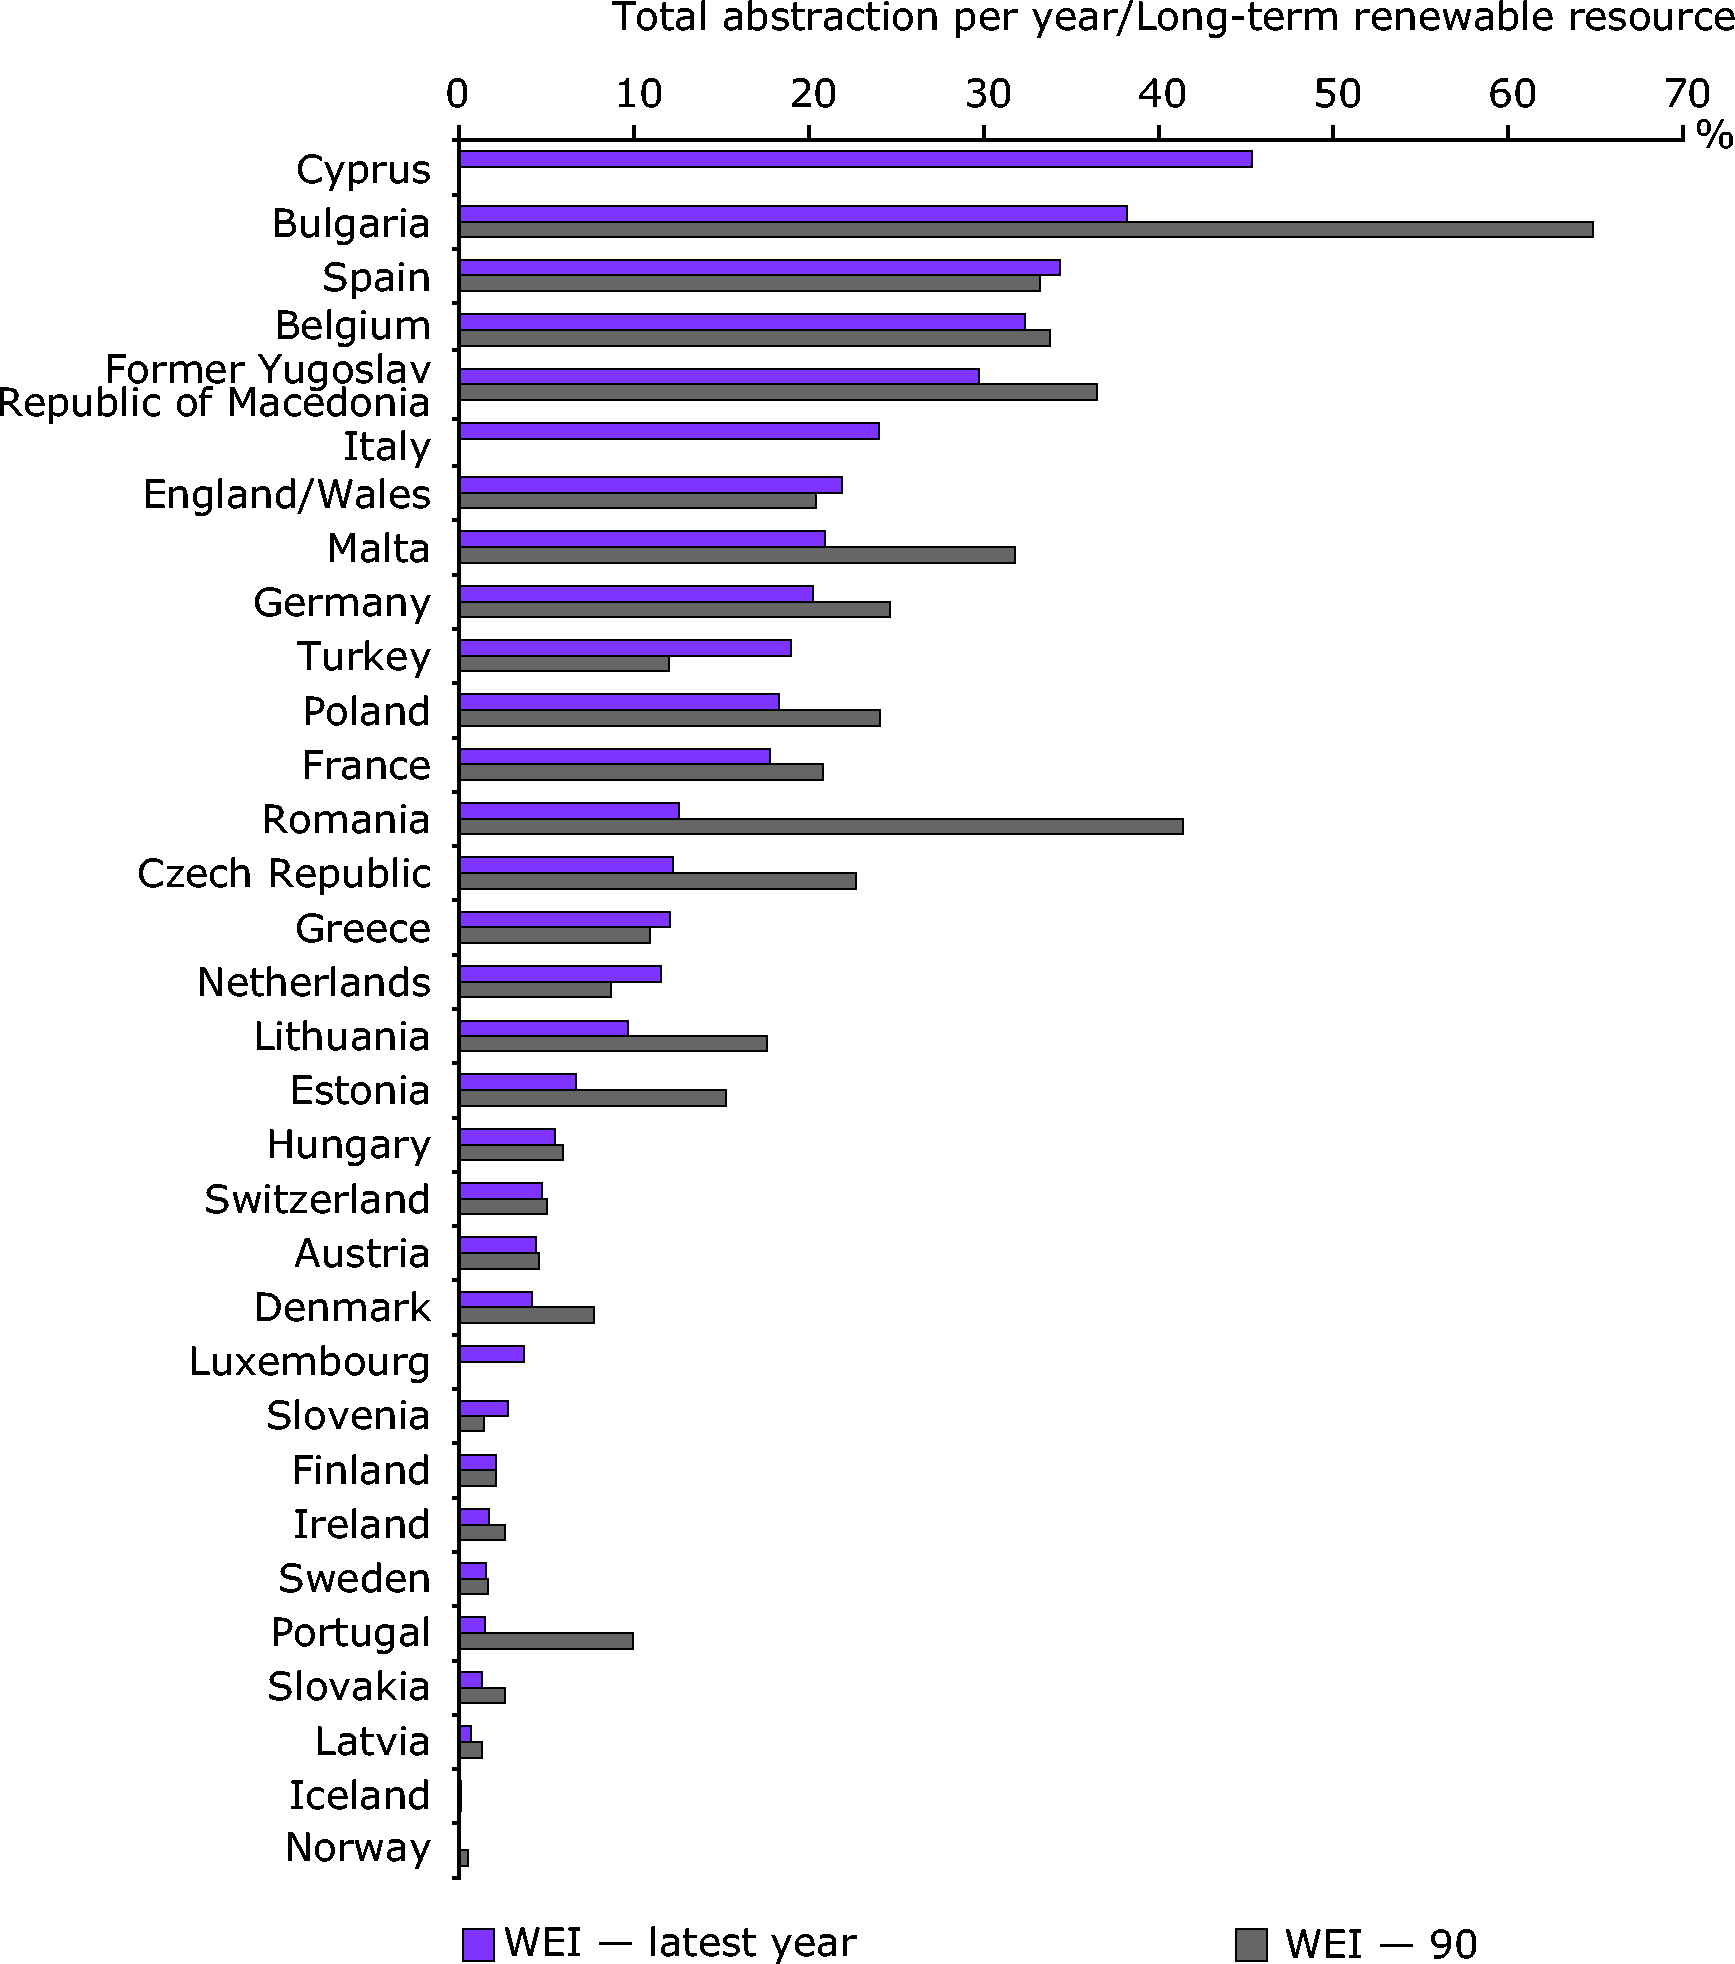
In simple terms, the index shows available water resources in a country or region compared to the amount of water used. An index of over 20 % usually indicates water scarcity. As the graph shows, nine countries are considered;water stressed: Belgium, Bulgaria, Cyprus, Germany, Italy, the former Yugoslav Republic of Macedonia, Malta, Spain, and the United Kingdom (England and Wales). WEI data are available for England and show that the South East and London are especially stressed. This level of information is key in terms of effective adaptation to climate change. By understanding how much water is available in a region, where it is coming from and who uses it, we will be able to build effective local strategies to adapt to climate change.


Document Actions
Share with others