Key findings
The first key theme of the Astana Ministerial Conference is 'Sustainable management of water and water-related ecosystems'.
Water issues are serious and worsening in many parts of Europe, making water management complex. While water is abundant in much of Europe, large areas are affected by water scarcity and droughts — particularly in Southern Europe and Central Asia with their severe lack of, and high demand for, water. Europe is also suffering from floods, with an increasing number of deaths, displacement of people and economic losses. Climate change is projected to exacerbate this, with more frequent and severe droughts or floods projected for many parts of Europe.
An estimated 120 million people in the pan-European region do not have access to safe drinking water or adequate sanitation, making them more vulnerable to serious water-related diseases. Despite progress over the past 15 years, especially those living in rural and remote areas in Eastern Europe, the Caucasus and Central Asia remain at risk. Water quality has improved in many parts of Europe over the past 20 years, the result of better regulation and enforcement together with investment in wastewater treatment plants.
At both the global and European scale a multitude of inland water assessments is available, with, in many ways, Europe leading the way in producing water assessments. This is partly driven by the production of EEA water assessments over 15 years as part of the 'state of the environment' (SoE) reports, supplemented by water assessment activities by OECD, UNECE and the World Health Organization and water statistics produced by Eurostat and OECD. The EU water policies, including their reporting obligations, also add relevant assessments on the status and pressures affecting EU waters. Finally, the establishment of Transboundary Water Commissions that produce assessments for the waters under their mandate have helped in developing a solid knowledge base on water assessments.
The information on water produced by European countries has markedly increased over the past 20 years, well documented by the information presented in the national freshwater assessments. For instance, the AoA review template contains 319 SoE and water reports from 48 countries covering the period 2005–2010. The increase in the production and dissemination of such reports is due to an increased understanding that environmental monitoring and information systems are crucial for developing environmental policy.
In many countries, a variety of national assessments that, inter alia, relate to water and water-related ecosystems are produced in the form of SoE reports, environmental statistics, environmental performance reviews, 'state of water' assessments, indicators, yearbooks and a range of thematic water reports.
Much attention has been paid to making the presentation of information inviting to the reader; the use of diagrams, graphs, charts and maps within the reports has much improved over the years. Moreover, the increased use of indicators has resulted in more targeted and compact information.
Nevertheless, producing factual, timely and easy-to-understand SoE assessments remains a challenge for several countries. In many cases the assessments are largely descriptive, being a compilation of different water issues with a strong focus on status and pressures. Some improvements over the years are visible. The information presented in assessments has changed from presenting the status of a few basic parameters on a limited number of locations to presenting status, sources, effects and policy measures on a much wider range of parameters, making them much more integrated. However, in most cases only limited information on policy performance, water management, implementation of measures, new challenges, etc., is provided, although this information is imperative to make the information useful for decision-makers.
The timeliness of relevant water information has also improved over the last ten years; often the data and information in the water assessments are only a few years old. However, for some countries part of the assessments are based on old data, in some cases more than ten years old. Regional and international assessments often have difficulty in collecting timely information.
Depending on the country, some freshwater environmental issues are more important than others and therefore the focus of the assessment varies between the countries. While all countries report about general water quantity and water quality issues, little reporting was found about newer issues including hazardous substances, impacts of water scarcity and drought, or water management.
Many water and water management issues that are important at the national level are related to similar issues that are important at the European level. Although the country information would be valuable for European water assessments to support and better document the analysis, the current data and information flows from country to European level are not optimal and not always based on the information and knowledge available nationally. To improve this situation, a consistent common approach and close cooperation between international organisations and countries is needed.
Main findings of the water assessments
The analysis of SoE and water assessments has revealed a multitude and variety of products, containing a wealth of information. At the same time, the analysis also revealed that much information is lacking and the policy relevance of the information remains weak. This is not only true of national assessments but also of regional ones.
In general, the regular assessments help to improve the quality of the data and information. An important flaw in many of the reports analysed is that they are generally rich in statistical data but are of limited use in the state-of-water assessment and in the policymaking process. To improve this situation, the analytic part of the assessments has to be improved, making the assessments more relevant in the policymaking process.
Assessments are currently too restricted to environmental status and trends and have to focus more on measures and management. Indicators help in simplifying the communication of various environmental issues to policymakers and the general public. Frameworks (e.g. the Driving Forces-Pressures-State-Impacts-Responses (DPSIR) framework) help in making assessments comparable between issues and countries. To improve future assessments it is recommended to work towards more integrated assessments. These provide information about the status and trends but also provide future outlooks based on policy directions.
More and more, countries are opening up their databases to public access and make water information readily available on the Web for reasons of accountability and trustworthiness. Where countries are providing information through web-based databases, the procedure of the international programmes collecting information through questionnaires becomes obsolete. The SEIS principles enable a situation in which national and regional assessments can be developed with up-to-date information. This exchange should be based on the SEIS principle that the data and information is managed as close as possible to its source.
2. Water and related ecosystems
The first key theme of the Astana Ministerial Conference is Sustainable management of water and water-related ecosystems. This chapter assesses the current state of the many assessments of water and water-related ecosystems that are currently produced. This chapter aims to identify options for a more focused pan-European reporting and assessment process to support decision-making, and in particular examines how a gradual extension of the Shared Environmental Information System (SEIS) across the region can contribute to this.
Section 2.1 contains an introduction and background on water assessments and a description of the methodology used. In Section 2.2 there is an overview of global and European water assessments, while Section 2.3 provides an overview of the wealth of national water assessments. In Section 2.4 there is a discussion of the type of analysis covered by water assessments, including water issues covered, data and information coverage, the information chain for policymaking and the linking of national water information to European level. Finally, in Section 2.5 there is a description of how these findings can be used to improve the pan-European reporting and assessment process.
2.1 Introduction and background
2.1.1 Setting the scene
Water issues are serious and worsening in many parts of Europe making water management even more complex (EEA, 2010a, b, c; Dalcanale et al., 2011). At the same time water is abundant in much of Europe, large areas are also being affected by water scarcity and droughts, particularly in Southern Europe and Central Asia where there is both a severe lack of, and a high demand for, water. Climate change will simply exacerbate this situation. The increase in frequency of water scarcity will have severe consequences on most sectors, particularly irrigated agriculture, tourism, energy production and the provision of drinking water (EEA, 2009). The unusually cold winter of 2008, for instance, left hydropower-dependent Kyrgyzstan and Tajikistan without electricity. In many locations, water demand often exceeds availability and over-abstraction is causing low river flows, lowered groundwater levels and the drying-up of wetlands, with detrimental impacts on freshwater ecosystems.
Europe is also suffering from flooding, with an increasing number of deaths, displacement of people and economic losses. Again climate change is projected to exacerbate this through an increase in the intensity and frequency of floods (EEA, 2008; 2011; Kundzewicz et al., 2010). Most of the observed upward trend in cost of flood damage can be attributed to socio-economic factors such as increases in population, more assets (buildings, industry, infrastructures etc.) and urbanisation in flood-prone areas, and to land use changes, such as deforestation and loss of wetlands and natural floodplain storage.
An estimated 120 million people in the pan-European region do not have access to safe drinking water and adequate sanitation, making them more vulnerable to serious water-related diseases. Despite progress over the past 15 years, those living mainly in rural and remote areas in Eastern Europe, the Caucasus and Central Asia (WHO/ UNICEF, 2010) remain vulnerable, making the Millennium Development Goal (MDG) of reducing by half the proportion of people without sustainable access to safe drinking water and basic sanitation a challenge.
Water quality has improved in many parts of Europe over the past 20 years, the result of better regulation and enforcement together with investment in wastewater treatment plants, mainly in Western Europe (EEA, 2010c). In Eastern Europe, economic transition since the early 1990's has helped as production has become cleaner, resulting in a decrease of pollution from industrial facilities.
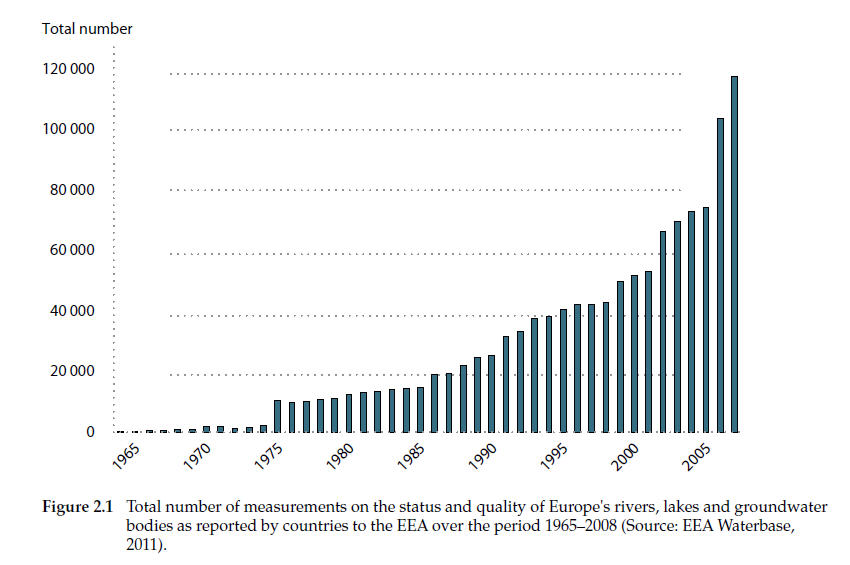
To meet the needs of a resource efficient future, sustain human and economic development and maintain the essential functions of our water ecosystems, an integrated and knowledge-based approach to water resource management is required. Adequate information is imperative to enable the identification of water management problems and to be able to monitor and evaluate the changes brought about by management measures.
Figure 2.1 shows that the number of measurements of the status and quality of Europe's rivers, lakes and groundwater bodies as reported to the EEA over the period 1965–2008 has increased markedly. It should be noted that this figure only shows the increase in water quality information as reported to EEA — many countries have much more data available than they report to the EEA, while the EEA has generally only asked for information after 1990.
The core objective of any water-related SoE assessment is to identify and quantify the current state of, and impacts on, the water environment, how these are changing over time and whether the measures taken at different administration levels are proving to be effective. To fulfil this objective, the information collected and disseminated needs to reflect the following issues:
- water management: what are the ecological, social and economic aims and goals of water management;
- state of water: how is it polluted (nutrients, pesticides, heavy metals, ecological quality, etc.) and how much is there (availability, runoff, water stress, etc.);
- time trends: is the state getting better or worse, within or outside agreed limits, and responding to measures or to other factors;
- pressures: what is causing the problem, issues relating to water abstraction and use, water pollution, threats by sectors (household, industrial, agricultural), climate change and natural factors, etc.;
- state of action on policies: what measures have been taken on national/regional level and are they working towards targets?
To build a comprehensive picture that addresses these issues on a national, regional, or international level, a wide range of information needs to be compiled and aggregated. The information for the assessment of the environmental state of European waters is collected/produced by numerous regional and national authorities. The EEA and other international organisations (8) have the mandate to produce global, European, and regional overviews of the state of water, pressures affecting the state and recommendations to manage water better.
2.1.2 Methodology
This chapter provides an overview of the available water assessments in the European region. To this end, the virtual library, the review template, and country fiches as described in Chapter 1, covering the time period 2005–2011, were used. Selections from the virtual library and the review template were made filtering on water related issues. The country fiches were used to develop an assessment of reporting by country and to assess individual reports. Box 2.1 lists the theme priorities covered by the review. These priorities wereendorsed by the first Steering Group of the AoA in order to serve as the basis for organising the available literature to be assessed by the countries in the framework of the AoA methodology. Assessments by international organisations were also analysed. Information from the recently published EEA SOER (2010) in particular was used.
Additionally, a more in-depth analysis was made of a random selection of individual reports as a full assessment of all the available reports was in practice impossible. The analysis entailed a detailed overview of the issues addressed in the selected reports, the organisations involved and the use of indicator frameworks. The overviews of water assessments were documented in a simple template that provides a first overview for each international organisation and country of the availability of water assessments. The focus was on the 'state of water' reports, environmental water-related indicator sets, statistical reports, and water chapters within 'state of the environment' reports and environmental performance reviews (EPRs).
Box 2.1
Theme priorities to be covered (9)
Water resources
- Water quantity and vulnerability (including extreme natural events)
- Desertification
- Water quantity (including glaciers and extreme events)
- Water consumption
- Vulnerability
Structural measures
- Infrastructure (including financial aspects, energy production, wastewater, desalinisation, pipes/channels/reservoirs)
Water quality and pollution
- Water quality and vulnerability
- Water pollution control
- Socio-economic aspects (e.g. access to drinking water)
Ecological state
- Living resources (fisheries)
- Habitat characterisation
- Ecosystems and biodiversity
- Protected and migratory species and protected areas
- Invasive species
- Ecosystem services and restoration
Water management
- Water management (including efficiency and adaptation measures)
- Governance (including transboundary issues)
2.2 Global and European water assessments
2.2.1 Global water assessments
Global water assessments generally included an extensive compilation of information, drawn from multiple sources, documenting the state of water, the resource and its uses. Reports may be a cooperation between different agencies/organisations such as the UN World Water Development Report or reports produced by one organisation.
On the global level, the United Nations is coordinating the water activities via UN‑Water (10) composed of representatives of 28 United Nations organisations. Other organisations outside of the United Nations are partners in UN-Water. A brief description of the global water activities and assessments are provided in Box 2.2.
Box 2.2
Water activities and assessments at the global level
- UNEPs Global Environmental Outlook (e.g. GEO-4) has a chapter assessing the state of water.
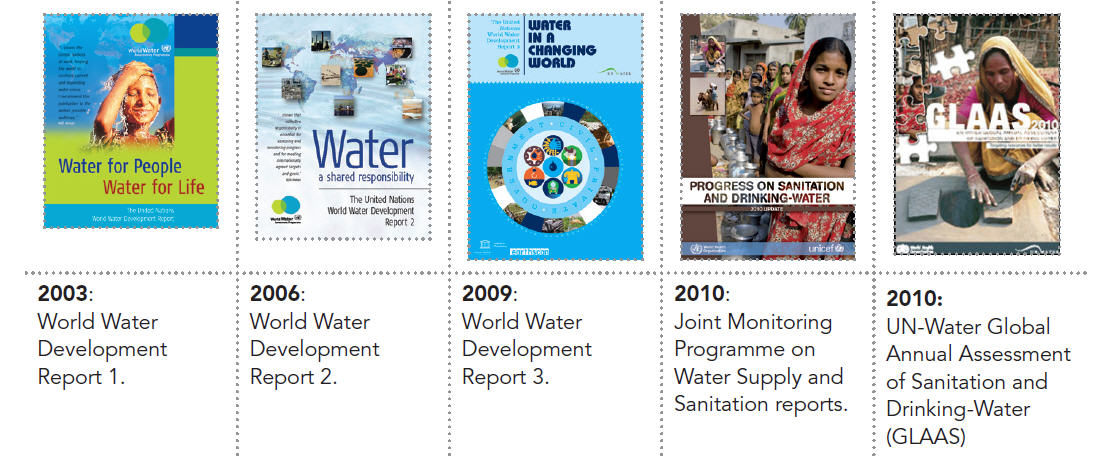
- The World Water Assessment Programme (WWAP) has produced the World Water Development Report (WWDR) every three years since 2003. These provide a comprehensive assessment of the state of the world's freshwater resources. The fourth World Water Development Report will be published at the sixth World Water Forum (Marseilles, 22 March 2012).
- WHO/UNICEF Joint Monitoring Programme on Water Supply and Sanitation Reports. The JMP reports assess the progress being made toward reaching the MDG water and sanitation targets.
- The Global Annual Assessment of Sanitation and Drinking-Water (GLAAS) is a UN-Water initiative implemented by WHO. The objective of UN-Water GLAAS is to provide policymakers at all levels with a reliable, easily accessible, comprehensive and global analysis of the evidence to make informed decisions in sanitation and drinking-water. WHO produces several assessments related to water and health including sanitation aspects and access to safe drinking water.
- UNESCO water family includes the International Hydrological Programme (IHE); UNESCO-IHE Institute for Water Education (UNESCO-IHE) World Water Assessment Programme (WWAP); and Water Centres. UNESCO is hosting a water portal and producing a series of thematic assessment reports. In UNESCO's publication database there are 119 water publications.
- Freshwater is one of the main areas covered by UNEP with more than 70 water publications being produced over the last ten years.
- The United Nations GEMS/Water Programme provides data and information on the state and trends of global inland water quality.
- FAO Water is a portal for FAO activities in relation to water. FAO Water has a multitude of water publications.
- The World Bank's latest water publications include Sustaining Water for All in a Changing Climate (2010) and Chapter 3, Managing land and water to feed 9 billion people and to protect natural systems in the 'World Development Report' (2010).
- UNDP's Human Development Report 2006 Beyond Scarcity: Power, poverty and the global water crisis.
- The Hydrology and Water Resources Programme of the WMO has many activities related to observation of the water cycle.
- The IPCC assessments contain much information on observed trends and projections on water resources, water quality and aquatic biodiversity, the main assessments being the Fourth Assessment Report: Climate Change (AR4, 2007) and the Technical Paper on Climate Change and Water (2008).
- UNEP's International Resource Panel. Water quantification and measurement, water efficiency and productivity (2011/2012).
One of UN-Water's key responsibilities is to monitor and report on the progress being made toward reaching internationally agreed water and sanitation targets, with particular focus on the targets set by the MDGs and the 2002 World Summit on Sustainable Development.
Global water statistics
At the global scale, there are several institutions publishing water statistics, graphs and maps (Box 2.3).
Box 2.3
Organisations involved in making water statistics available at the global level
- UN-Water (Statistics) and WWAP (Facts and Figures) homepages present statistics related to water.
- The Environment Statistics Section of the UNSD is engaged in the development of methodologies, data collection, technical cooperation, and coordination in the fields of environmental statistics and indicators. The International Recommendations for Water Statistics (IRWS) were adopted by the UN Statistical Commission (UNSC) at its 41st Session (2010).
- The System of Environmental-Economic Accounting for Water (SEEAW) was developed to address the need for integrated information on water resources and their management. It was recognised that the SEEAW provides a much-needed conceptual framework for organising hydrological and economic information in support of Integrated Water Resource Management (IRWM). UNSC adopted the SEEAW as an interim international statistical standard at its 38th Session in 2007.
- FAO Aquastat database provides data and information on water and agriculture by country
- Waterwiki as a joint activity of several UN organisations provides water profiles per country.
- The JMP for Water Supply and Sanitation provide maps, graphs and tables related to the MDG on water supply and sanitation.
- World Bank Water Data and Statistics
- UNEP-GEMS provide via GEMS Water and GEMStat access to water quality data from national river monitoring sites.
- The Global Runoff Data Centre (GRDC) provides data sets on river flows.
- WRI, Earthtrends provides data tables on water resources and freshwater ecosystems
- International Benchmarking Network for Water and Sanitation Utilities (IBNET) has datasets with water utilities.
Global water indicator initiatives
At the global scale, there are several initiatives to establish water indicator sets; examples are listed in Box 2.4.
Box 2.4
Examples of global water indicator initiatives.
- Indicators have been established to illustrate the MDG Target 7.C: 'Halve, by 2015, the proportion of people without sustainable access to safe drinking water and basic sanitation'.
- UNSD Environmental Indicators disseminate global environment statistics on 10 indicator themes compiled from a wide range of data sources including indicators on inland water resources.
- The first edition of the World Water Development Report (2003) included more than 160 indicators. The plan was to update them in the forthcoming WWDRs but in the 2009 edition less than 60 of the indicators were updated. A World Water Assessment Programme Expert Group on Indicators, Monitoring and Data/Metadata Bases has been established with the aim of ensuring regular, updated indicators for the WWDR reports.
- The indicator set for sustainability development produced by the UNCSD (revised in 2006) contains several water indicators.
Other global water assessments
The Millennium Ecosystem Assessment (2005) covered freshwater in the Current State and Trends Assessment, Chapter 7 Fresh water and Chapter 20 Inland water systems, and in the Responses Assessment Chapter 7 Freshwater ecosystem services.
The Convention on Biological Diversity (CBD) has produced several assessments of inland water biodiversity.
The Worldwatch Institute produces its annual State of the World reports, often with a focus on water issues and its Vital Signs indicator factsheets cover many water aspects. Worldwatch also has several reports on water management.
The Pacific Institute is one of the leading actors in producing global and United States water assessments. The main assessment from the Pacific Institute is a biennal book of global freshwater resources, World's water. Data tables from the book are available online.
During the last 10 years much focus has been on establishing a water footprint for countries and products. The Water Footprint Network (11) has recently developed a global water-footprint standard.
The World Water Council (WWC) has produced around 35 water assessments since 2006 and the Global Water Partnership (GWP) has several publications in particular focused on integrated water resource management.
A key activity of WBCSD is water; it has produced several water publications over the last years. The 2009 Water Facts and Trends provides an overview of some basic facts and societal challenges related to water, while global water resource scenarios are included in the 2006 report: Business in the World of Water: WBCSD Water Scenarios to 2025.
2030 Water Report: Charting our water futures, produced by the 2030 Water Resource Group, describes future water resource problems.
2.2.2 European water assessments
European water assessments should generally:
a) provide the basis for identification and assessment of environmental problems and the dominant threats at regional and European levels;
b) provide information necessary to enable actions/policies to be taken to improve the environmental state of the water bodies and ensure sustainable development;
c) be based on the most relevant time and space scales to meet the above two objectives.
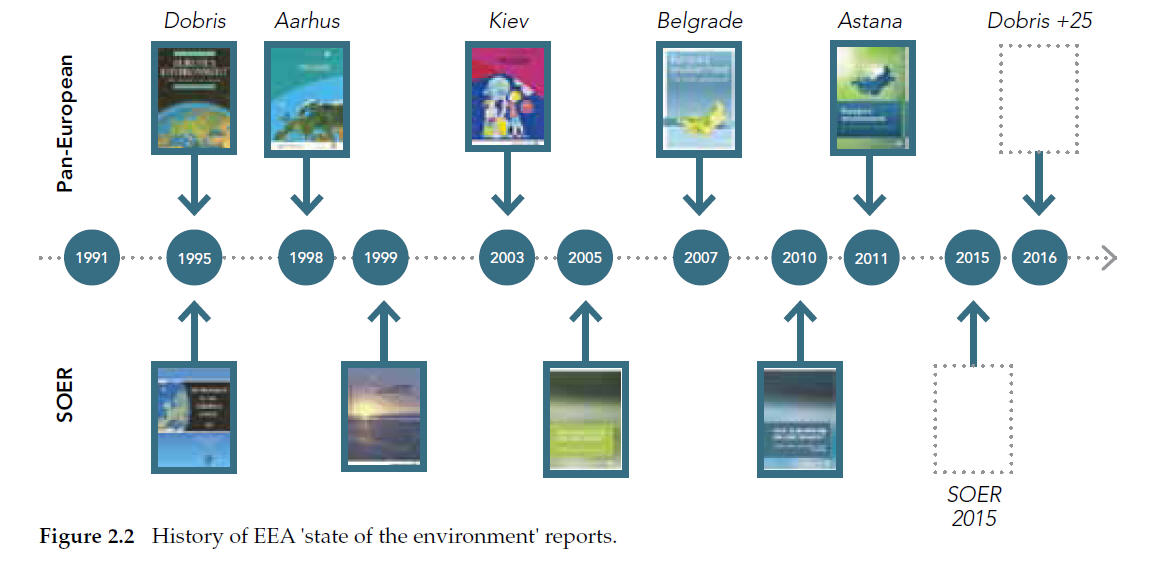
The amount of water information and number of assessments produced at European level has increased markedly since the publication of the Dobris Assessment (EEA, 1995). Assessment of the status of water and pressure has always been an important part of the EEA state and outlook reports (SOERs).
The EEA has the mandate to produce objective, reliable and comparable information to allow the EU, countries and the general public to judge the effectiveness of policy and the needs for policy development. To this end, the agency has produced:
- several 'state of environment' reports with chapters and sections describing the state and management of water;
- the recently published SOER 2010 which has water sections in its Synthesis on freshwater; two separate thematic assessments: water quality and water resources: quantity and flows. The 38 EEA member and cooperating countries also produced separate natural freshwater assessment describing the main freshwater issues in each country as part of the SOER process;
- seven (core set) water indicators that are updated annually. Water indicators also appear in other indicator sets such as the agri-environmental, SEBI and climate change impact, and data on European waters can also be retrieved and visualised through WISE;
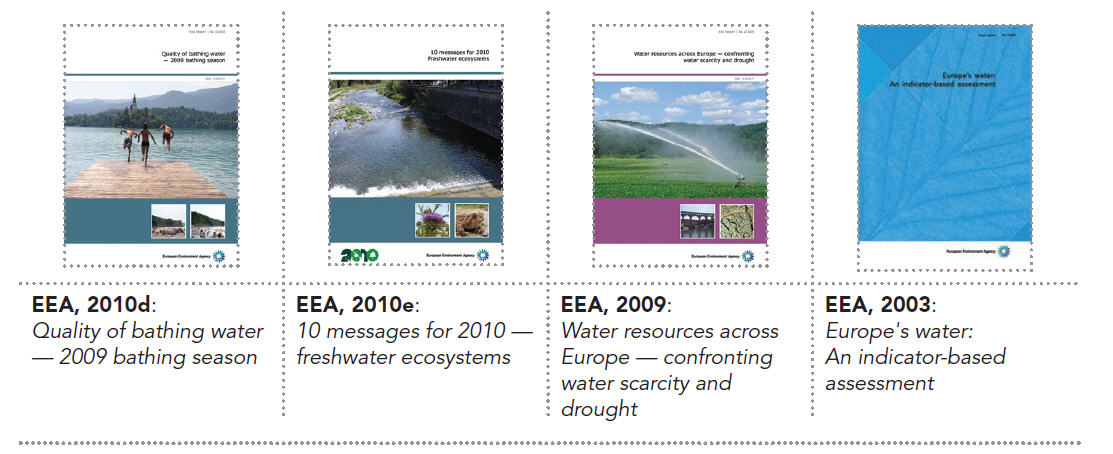
- EEA has published more than 70 water assessments (12), including:
The data and information EEA uses for its 'state of environment' assessments of Europe's waters are generated through national and river basin monitoring networks set up for national or EU level purposes, such as the monitoring activities established in relation to the Water Framework Directive. Up to 38 European countries (13) report a sub-sample of national results and results generated in relation to EU water directives to the EEA each year. These are made widely available through the Water Information System for Europe (WISE) (14).
In several previously described global water assessments and global 'state of the environment' reports there are chapters or sections describing the state of Europe's water. The World Water Development Reports (WWDR) include, for example, a number of European cases studies. The WWDR4, to be published in March 2012, will have a European chapter. Similarly, many of the global state of the environment/ thematic assessments, for example, GEO4, the Millennium Ecosystem Assessment, and IPCC's AR4 (Working Group II), have European chapters/sections.
Under the UNECE Convention on the Protection and Use of Transboundary Watercourses and International Lakes (Water Convention), and its Protocol on Water and Health (15) and working groups, several publications on water have been produced. In 2007 the First Assessment of Transboundary Rivers, Lakes and Groundwaters was published — the first ever in-depth report produced on transboundary waters in the UNECE region covering 140 transboundary rivers and 30 transboundary lakes in the European and Asian parts of the region, as well as 70 transboundary aquifers. The assessment aims to inform, guide and stimulate further action by Parties to the Convention to improve the status of transboundary waters. UNECE is working on a second assessment for the Astana Ministerial Conference. In addition, the first reporting exercise under the UNECE/WHO-Euro Protocol on Water and Health was conducted during autumn 2009/spring 2010 leading to the first regional implementation report of the Protocol.
European Union institutions — the EU Commission (DG Environment, Eurostat and the Joint Research Centre (JRC)) and European Parliament — have produced several water assessment reports over the last 10 years.
The EU Commission DG Environment publishes water directive implementation reports, staff working documents and studies. These include reports related to the implementation of the urban wastewater treatment, nitrate and water framework directives and reports on water scarcity and droughts.
Eurostat databases include information on water abstraction, water use and wastewater treatment, collected every two years from countries through the joint Eurostat-OECD questionnaire. Eurostat uses the information in a variety of publications such an annual environmental indicator report and the EU sustainable development indicators. Examples of relevant Eurostat water publications and indicator sets are the Environmental statistics and accounts in Europe (2010), the Energy, transport and environment indicators (2011), and the Environmental statistics in the Mediterranean countries: compendium 2005.
The World Health Organization European Office produces assessments on water and sanitation regularly and aims at developing an environment and health indicator system including relevant water indicators.
DEWA/GRID-Europe is part of UNEP's global network of environmental information centres, known as the Global Resource Information Database (GRID). During the last ten years UNEP DEWA/GRID-Europe has produced several water-related assessments.
Over the past 20 years the OECD has produced several water assessments covering the following policy areas: water and multilevel governance; water resource management; agriculture and water management; drinking-water supply and sanitation; water supply and sanitation programme in EECCA countries; private sector participation in the water and sanitation sector; and aid for water and sanitation.
Examples of recent OECD water assessments are:
Other organisations that produce European water assessments are:
- World Bank: Water resources in Europe and Central Asia (2003);
- NATO programme for Science for Peace and Security has published several assessments on water issues;
- EUREAU is the European Federation of National Associations of Water and Wastewater Services. In 2009 EUREAU published a comprehensive statistical overview of the water sector in Europe and of each EU Member State.
- the PlanBleu — covering states bordering the Mediterranean Sea — has over the years produced several water assessments including A Sustainable Future for the Mediterranean: the Blue Plan's Environment and Development Outlook (2005) and the State of the Environment and Development in the Mediterranean — 2009;
- in 2009, the Alpine Convention produced a comprehensive assessment of waters in the Alps;
- European environmental NGOs, including the World Wide Fund for Nature, the European Freshwater Programme and the European Environment Bureau, produce water assessments.
- UNEP/GEF's Global International Water Assessment produced several reports describing the status of European seas, including information on river catchments.
International cooperation in Central Asia is described in Box 2.5.
Box 2.5
International cooperation in Central Asia
The UN system plays a crucial role in supporting national authorities and institutions in Central Asia in the field of the environment and water management. Such international organisations as ADB, SIWI, UNEP, UNDP and USAID provide support in developing assessments of, amongst others, the state of sub‑regional ecosystems with a focus on transboundary water-resource management. Additionally, a number of institutions established by Central Asian countries develop sub-regional assessments. These include:
- the Interstate Commission for Water Coordination (ICWC) annually establishes the water-quantity quota for each participating country within the main water courses (Amu Daria and Syr Daria);
- the Interstate Commission for Sustainable Development (ICSD) coordinates sub‑regional cooperation in the field of environment and sustainable development;
- the Regional Environmental Centre for Central Asia (CAREC), a sub-regional professional organisation established by five of the Central Asia countries, the European Commission and UNDP, has implemented a number of sub-regional assessments;
- the Central Asia countries, as part of the Pan-European region, benefit from participation in the EECCA cooperation process, in which the UNECE and OSCE play a significant role by assisting countries in the integration of progressive environmentand water-management tools. This includes the development of environmental compendiums and a set of environmental indicators for EECCA by UNECE and UNEP, which are actively used by Central Asian countries.
Finally the establishment of Transboundary Water Commissions (see Box 2.6 for an overview of several European transboundary commissions) that produce assessments for the waters under their mandate helped develop a solid knowledge base on water assessments.
Box 2.6
Listing of European Transboundary Water Commissions dealing with freshwater (not exhaustive)
- Border River Commission between Finland and Sweden (Finland, Sweden);
- Commission for the Implementation and Development of the Convention on Cooperation for the Protection and Sustainable Exploitation of Waters from Luso-Spanish River Basins (Portugal, Spain);
- Commission on the Use of Water Management Facilities of Intergovernmental Status on the Rivers Chu and Talas (Kazakhstan, Kyrgyzstan);
- Finnish Norwegian Transboundary Water Commission (Finland, Norway);
- Franco-Swiss Genevese Aquifer Management Commission (France, Switzerland);
- International Commission for the Protection of the Danube River (Austria, Bosnia and Herzegovina, Bulgaria, Croatia, Czech Republic, Germany, Hungary, Moldova, Montenegro, Romania, Serbia, Slovakia, Slovenia, Ukraine);
- International Commission for the Protection of the Elbe (Germany, Czech Republic);
- International Commission for the Protection of Italo-Swiss Waters (Italy, Switzerland);
- International Commission for the Protection of Lake Constance (Austria, Germany, Switzerland);
- International Commission for the Protection of Lake Geneva (France, Switzerland);
- International Commission for the Protection of the Oder against Pollution (Czech Republic, Germany, Poland);
- International Commission for the Protection of the Rhine (Germany, France, Luxembourg, the Netherlands, Switzerland);
- International Commission for the Scheldt (Belgium, France, the Netherlands);
- International Commissions for the Protection of Mosel and Saar Against Pollution (France, Germany, Luxembourg);
- International Meuse Commission (Belgium, France, the Netherlands, Germany, Luxembourg);
- International Sava River Basin Commission (Bosnia and Herzegovina, Croatia, Slovenia, Serbia);
- Interstate Commission for Water Coordination of Central Asia (Kazakhstan, Kyrgyzstan, Tajikistan, Turkmenistan, Uzbekistan);
- Peipsi Center for Transboundary Cooperation (Estonia, Russia).the Interstate Commission for Sustainable Development (ICSD) coordinates
2.3 Overview of national water assessments
In many countries, a variety of national assessments that, inter alia, relate to water and water-related ecosystems are produced in the form of SoE reports, environmental statistics, environmental performance reviews, 'state of water' assessments, indicators, yearbooks and a range of thematic water reports. Beyond these, contributions are made to international assessments. The data and information needed for such assessments come from a limited set of data collections, monitoring networks, and statistical tables, etc.
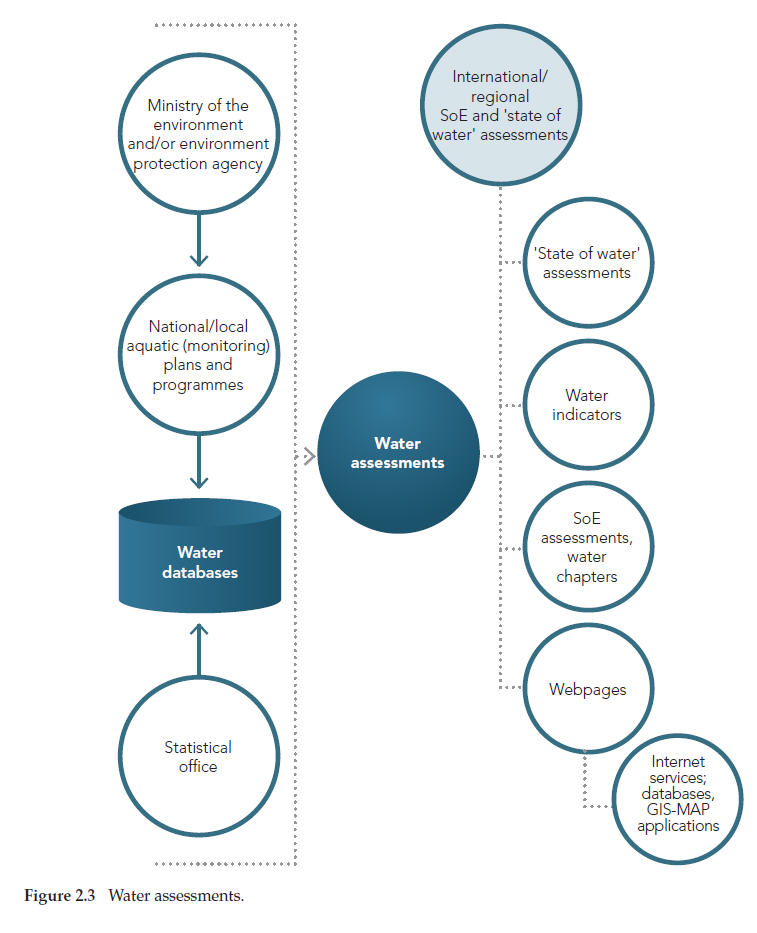
Figure 2.3 shows how water assessments are produced by countries. Where traditionally water information was reported in the form of tables, with the increasing amount of information now available (see Section 2.1.1) and the possibilities of managing information through ICT, reporting is changing. Nowadays, more and more countries use diverse ways of disseminating the information. The available data and information are, on the one hand aggregated for assessments, reports and indicators, and, on the other, are published through homepages as, for example, indicator factsheets, and internet services such as databases and GIS-maps. A still modest but growing tendency is to produce reports that provide aggregated information, while the more basic, disaggregated information is accessible through websites and online databases.
2.3.1 Organisation of national water assessments
National environmental assessments are, in general, produced or commissioned by governments and government related institutions (Lovett et al., 2007). Annex 2.1 provides an overview of the national/sub-national institutions that produce SoE assessments, statistical yearbooks, and national water reports.
Annex 2.1 shows that mostly environment ministries or environment (protection) agencies, which usually fall under the responsibility of these ministries, are responsible for producing SoE reports. Exceptions include the Czech Republic and Estonia, where SoE assessments are carried out by environmental information centres.
Statistical yearbooks are usually produced by statistical offices that are often the responsibility of ministries of the interior.
Many reports are published as paper reports, but are usually also available online. Figure 2.4 gives an overview of the ways SoE and water assessments are made available.
Water reporting is done by environment ministries, the water department in these ministries, or environment (protection) agencies. In the latter case, this is mostly the same institute as the one producing the SoE assessment. In several countries regional sub-units also produce SoE reports. These include the United Kingdom (England and Wales, Scotland, Northern Ireland), Belgium (Flanders, Wallonia, and Brussels) and Poland (voivodships).
Approximately one third of national assessments are produced through cooperation with other ministries, for example, in the Russian Federation and Georgia; other national institutes, as in Norway, Portugal, Slovakia and Tajikistan; regional offices or institutes, as in Italy and Portugal; or international organisations as in Kazakhstan and Serbia. Most of the assessments are concerned with the national level, but approximately one fifth of them target the sub-national level.
A range of detailed thematic reports, such as assessments of climate impacts on water or diffuse pollution, are produced. Such water assessments are often used for water chapters in SoE reports, in environmental statistics yearbooks and for water indicators in environmental/sustainable development indicator sets. During the last years, several countries have established internet-based services — many of the environment ministries and their collaborating institutions have water topic websites that provide information to the interested public on water resources, water pollution and state of water, usually in the form of downloadable publications and increasingly in the form of access to monitoring results such as (aggregated) data, databases and web-GIS functionality.

Box 2.7
National assessments in the southern Caucasus
- The Environmental Impact Monitoring Centre of the Ministry of Nature Protection of Armenia publishes monthly and annual bulletins in Armenian language, which contain data on surface water quality.
- The Armenian State Hydro-Meteorological Service of the Ministry of Emergency Situations publishes annual hydrological reference books including information on surface water quantity.
- A Study for Improvement of Rural Water Supply and Sewage Systems in the Republic of Armenia was prepared in 2009 within the frameworks of a project, funded by the Japanese International Cooperation Agency (JICA).
- An assessment report Water Utility Service Quality Monitoring for Water Systems in Armenia was prepared in 2008 within the USAID Program for Institutional and Regulatory Strengthening of Water Management in Armenia.
- The Ministry of Ecology and Natural Resources of the Republic of Azerbaijan periodically publishes bulletins on surface water quality. In addition, special bulletins, which are disseminated through mass media and are placed on the internet, are prepared on the monitoring results from the transboundary rivers.
- The Georgian National Environmental Agency of the Ministry of Environment Protection publishes monthly and annual bulletins, which contain data on surface water quality and quantity.
- A report Fisheries and Aquaculture in Georgia — Current Status and Planning was prepared by FAO in 2006 within the Strengthening the Capacity of the Department of Fisheries to Support Fisheries Sector Rehabilitation technical assistance project.
- A report Integrated Coastal Zone Management Strategy for Georgia was prepared in 2009, within the European Commission funded Environmental Collaboration for the Black Sea project, which was implemented in Georgia, Moldova, Russia and Ukraine, providing analytical information on the ICZM process in Georgia and assessing the natural and socio-economic factors related to the coast.
2.3.2 Water assessments as part of wider 'state of the environment' reports
'State of the environment' reports
'State of the environment' reports are produced by almost all countries, usually by ministries of environment or associated institutions (Section 2.3.1). These reports include a wide range of issues. While most SoE reports largely focus on reporting about the status and trends of environmental issues, some take a much broader perspective looking at environmental issues in the broader context of socio-economic issues.
Most countries produce SoE reports every 1–5 years and the majority of SoE reports assessed for this report have been published recently, between 2008 and 2010. The information included is typically not more than two years old, although in some of the reports, four year old data is used. This indicates that the countries are aware of the importance of up-to-date environmental information. Almost all reports contain texts complemented by statistics in the form of graphs and/or tables. Approximately half of the countries also use indicators to describe their environmental status.
The size of the SoE reports in the pan-European countries varies from some 100 pages for the Czech Republic, France, Italy and the United Kingdom, through 300 pages for Ireland to more than 500 pages for the Russian Federation. The volume of SoE reports is in general reduced when information is available in the form of indicators or statistics. Some of the SoE reports are complemented by websites with additional information. In such cases, the chapters merely summarise the findings from the available information and do not have to explain the information used to produce the report as that information is accessible on the web.
Approximately half of the countries published their reports in English or include an English summary.
Environmental issues are seldom discussed from an integrated perspective, for example, by relating environmental quality to socio-economic activities and their interactions. This applies for water assessments that usually consider rivers, lakes, groundwater, bathing water, etc. separately. For example, the interaction between groundwater and surface water is rarely discussed, while socio-economic activities are often only mentioned as sources of pressure. The lack of integration is connected to the limited mandates of the institutions responsible for the assessments. However, policy relevant water assessments would benefit from integration across the various topics.
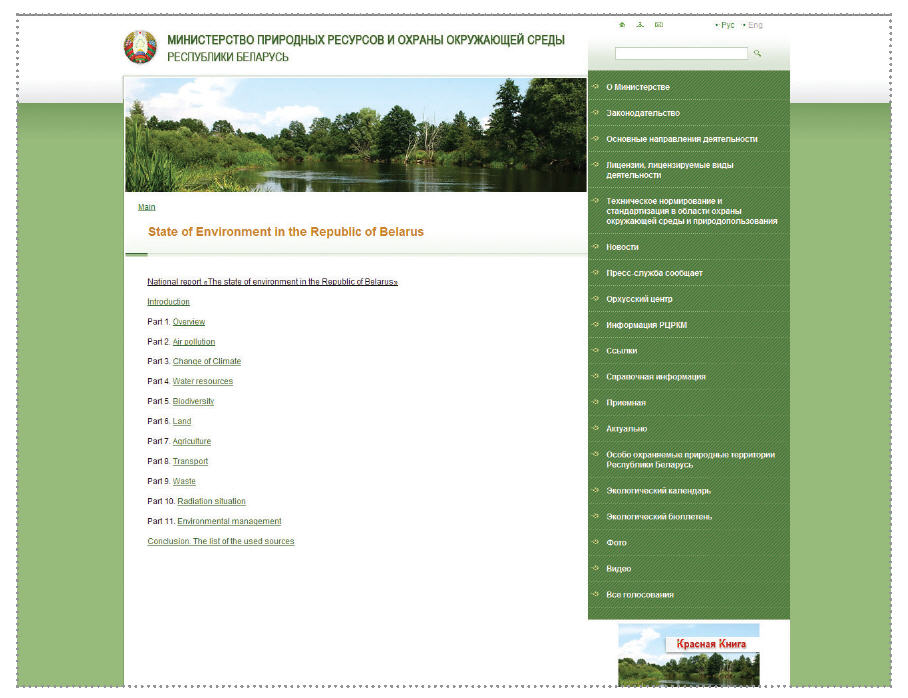
The state of environment of the Republic of Belarus
The latest national SoE report The state of environment of the Republic of Belarus(Minpriroda, 2010 (16)), covering the years 2005 to 2009, was published in 2010. It was prepared for government organisations involved in environmental management and research, public organisations, the public at large and foreign partners, providing objective information about the state of the environment, natural resources and the Republic of Belarus' state of protection.
Water is covered in Part 4: Water resources, which includes sections on renewable freshwater resources, freshwater data, domestic water consumption per person, the quality of drinking water, water loss, re-use and recycling of freshwater, waste water discharge into water bodies, surface water, biochemical oxygen demand in river water, the concentration of ammonia nitrogen in the river water, nutrients in rivers and the capacity of waste-water purification facilities.
Water chapters in 'state of the environment' reports
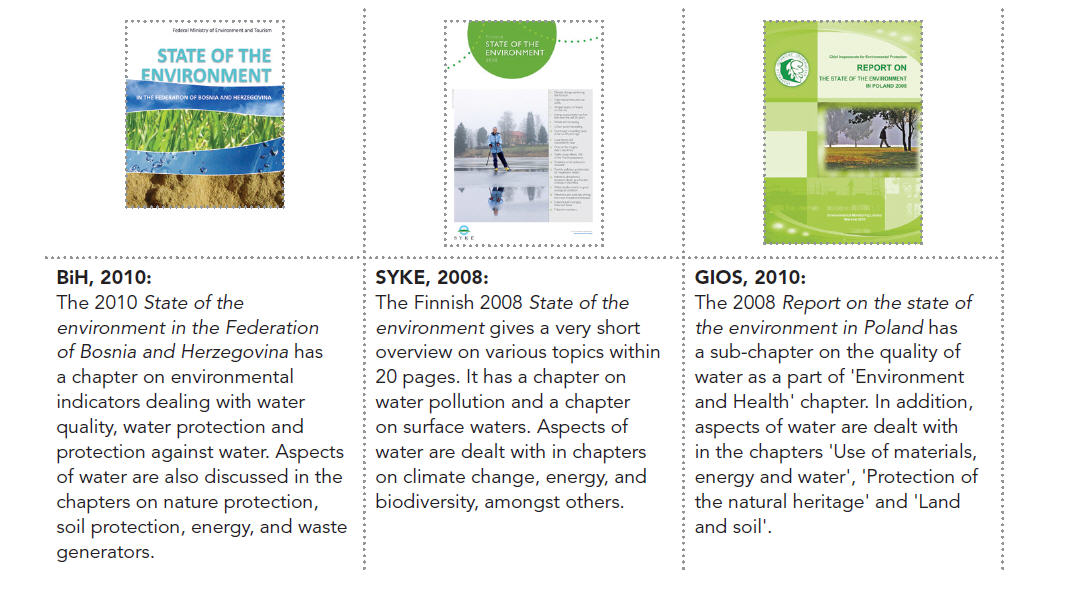
Mostly, SoE reports have separate chapters dealing with water. These usually present some hydrological characteristics and the water-quality status. Additionally, depending on the focus of the report, various issues such as water-management objectives, legislation, drinking water, fisheries, other water uses and pollution sources are discussed. In addition to the water chapters, other chapters also cover water aspects such as:
- water use of sectors and influence of sectors on water, e.g. wastewater discharge, irrigation, cooling water, or use of fertilisers;
- natural hazards, dealing with floods and droughts;
- environment and health, e.g. drinking and bathing water quality;
- climate and climate change, dealing with precipitation, droughts, floods, and impact of climate change on water quality;
- ecosystems, dealing with wetlands and other water-related issues like desiccation.
Some examples include:
The space allocated to water and water-related topics as part of recent SoE assessments varies; Croatia and Czech Republic allocate the least, 9 per cent of the report; France, 15 per cent and Italy at 14 per cent are in the mid-range; while Kosovo with 27 per cent, Ireland with 28 per cent, Kyrgyzstan, 33 per cent and Poland, 28 per cent, devote up to a third of the available space to water — Finland even devotes 41 per cent of its SoE assessment to water and water related topics. On average, some 15 per cent of SoE assessments deal with water issues.
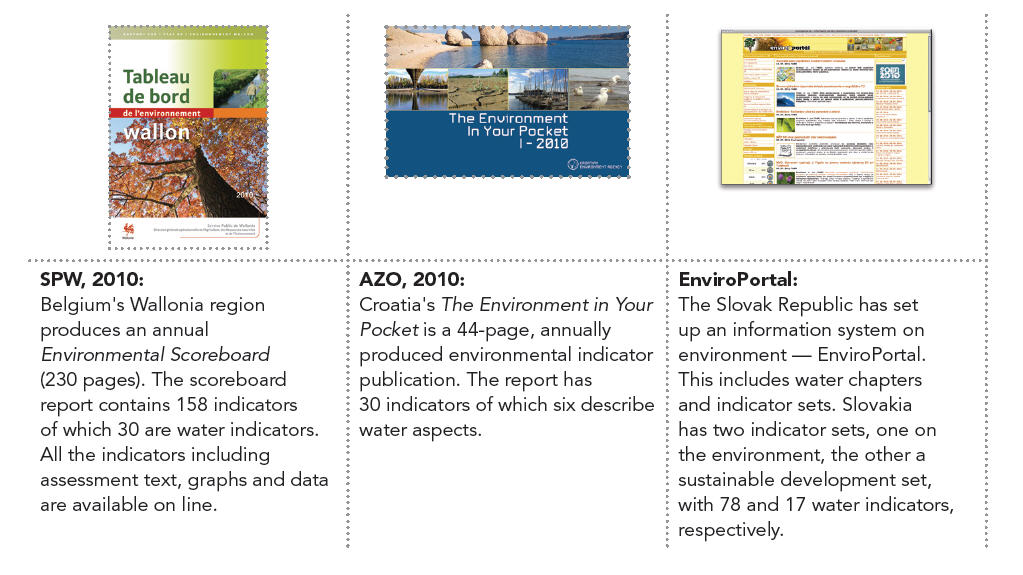
Environmental indicators
Indicator sets are used by many countries (17). Many of these sets include selections of parameters, that are considered indicative for specific water management issues, as used for example by Croatia, Denmark, Estonia, Luxembourg, the former Yugoslav Republic of Macedonia, Moldova, Russian Federation, Serbia and Slovenia. Others, including the Czech Republic, use the EEA core set of indicators or use indices, Azerbaijan and Portugal use composite indicators or, like Armenia, focus on socio‑economic issues. The national water indicators are often complemented with statistical data, such as indicators related to water abstraction and use, and wastewater treatment. Some examples of environmental indicator sets include:
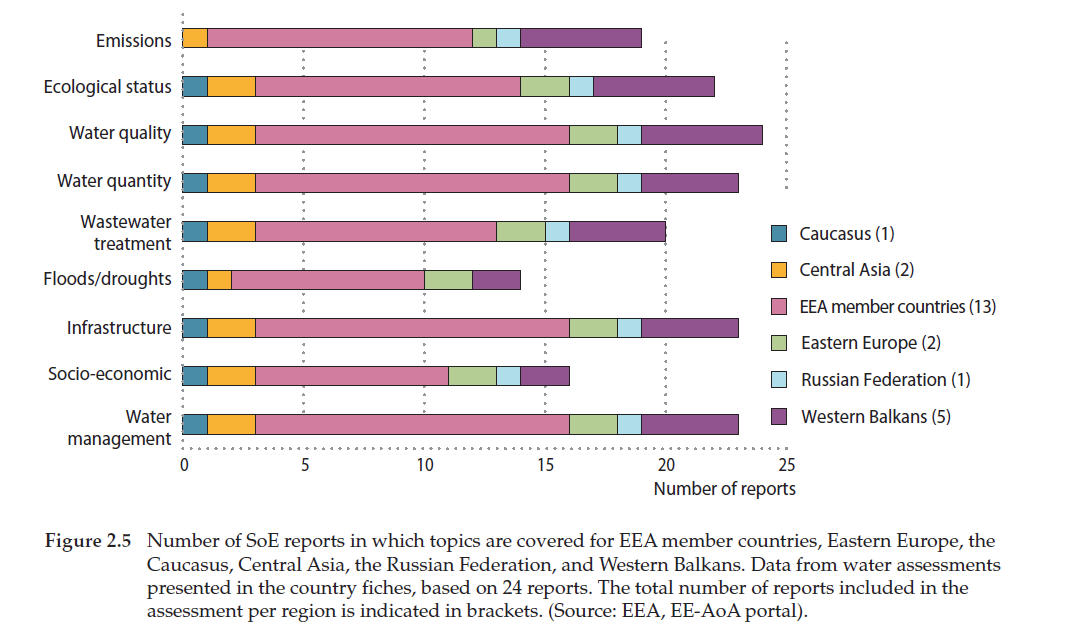
Topics addressed in water chapters of SoE reports
Figure 2.5 presents an overview of the topics addressed in the SoE reports of a selection of countries (18). This overview shows that:
- water management issues, describing the water management context, are included in all reports;
- EEA member countries and cooperating countries (Western Balkans) do not always include socio-economic issues in their SoE reports;
- information on infrastructural measures are reported by all countries;
- information on floods and/or droughts is, however, much less reported.
- information on water quantity and water quality is provided by all countries;
- most EEA and Western Balkan countries provide information about wastewater treatment;
- it is noticeable that the ecological status is not reported by some EU Member States who would be expected to deal with this within the framework of the Water Framework Directive;
- while most EEA member countries do, only a few countries in Eastern Europe, the Caucasus and Central Asia report on emissions to water, which may be due to the limited availability of data.
Omissions of topics may not be a matter of missing information but may be due to the opinion that these topics are not so much part of SoE reporting but rather ought to be reported though thematic reports.
This overview of topics only provides a rough indication of what is reported, with the level of detail varying substantially between countries. On the whole, however, the fact that countries do report on such topics as the water management context and emissions to water shows that increasing attention is being paid to information related to water policy implementation.
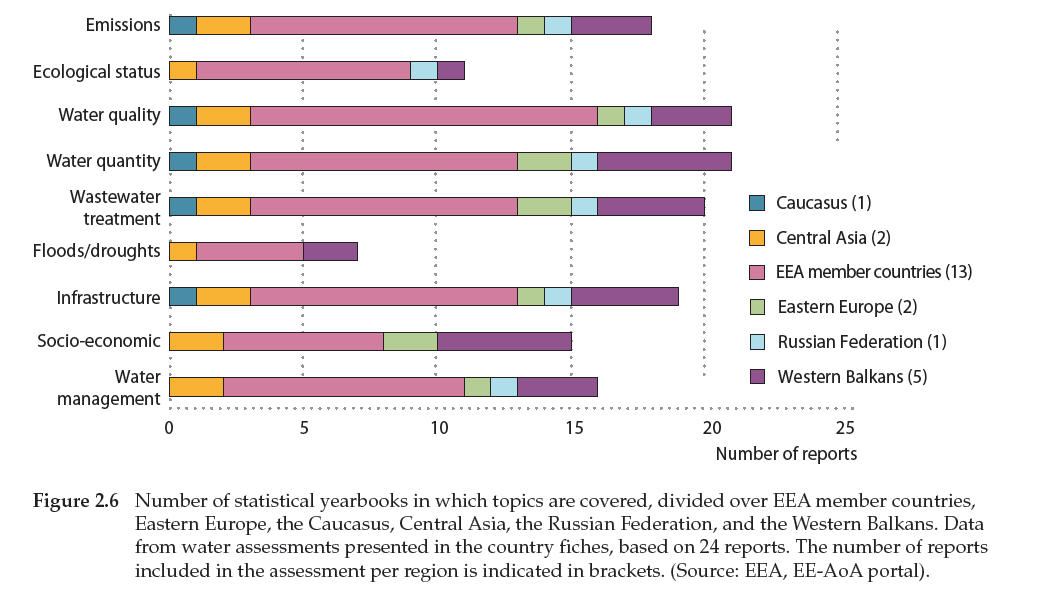
2.3.3 Environmental statistics
The national statistical offices often collect environment-related statistical data following methods that were introduced 10–20 years ago, with only minor changes over the years. In relation to water and related ecosystems the collected statistics cover the following:
- water abstraction by source and sector;
- water use by socio-economic sectors;
- wastewater treatment and discharge of pollutant;
- costs of environmental protection; and
- payments for environmental pollution.
Environmental statistical yearbooks often report data in the form of tables. Examples are:
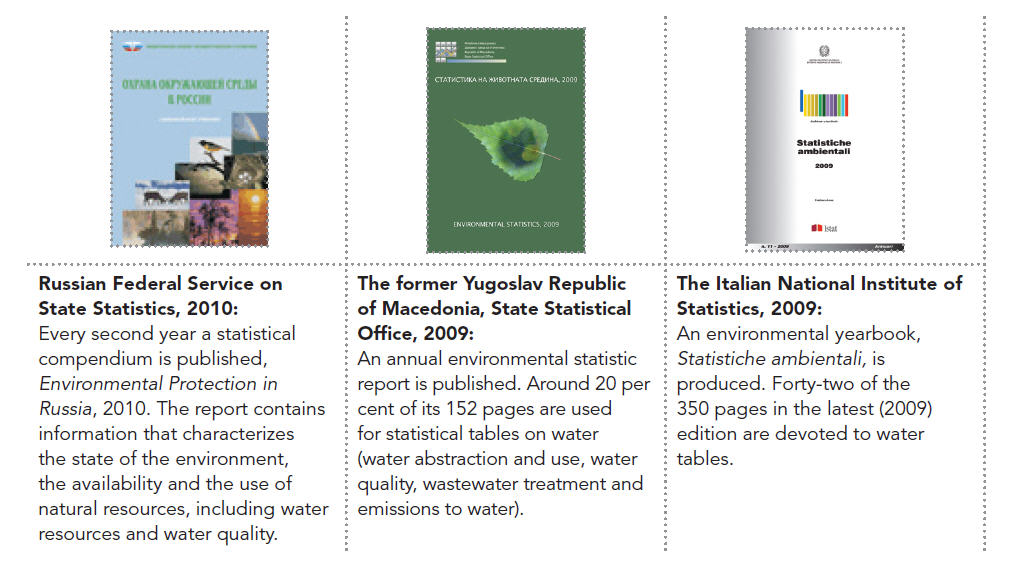
In some cases water statistics are published as small publications (briefings, statistics in focus etc.) and water statistic tables are made available through databases. In some cases, however, statistical offices produce sustainable development indicators or more assessment oriented publications.
The purpose of environmental statistical reports usually differs from the purpose of SoE reporting.
- SoE reports focus on the environmental situation (status), the problems and issues and how these problems can be overcome. This is reflected in the SoE reports where status, pressures and impacts are important elements, and policies and measures are described.
- Statistical reports on the other hand, focus more on the socio-economic aspects of the environment, looking at use, processing, waste, implementation of policies and costs, and revenues from, for example, payments for wastewater treatment from different sectors. From these reports, information can often be derived about drivers, pressures and responses.
The statistical reports typically provide additional information that is often not included in SoE reports and are therefore potentially important sources of information for integrated assessments.
2.3.4 'State of water' reports
Most countries produce specific 'state of water' assessments on a regular basis, in addition to the more general SoE assessments. Here are some examples:
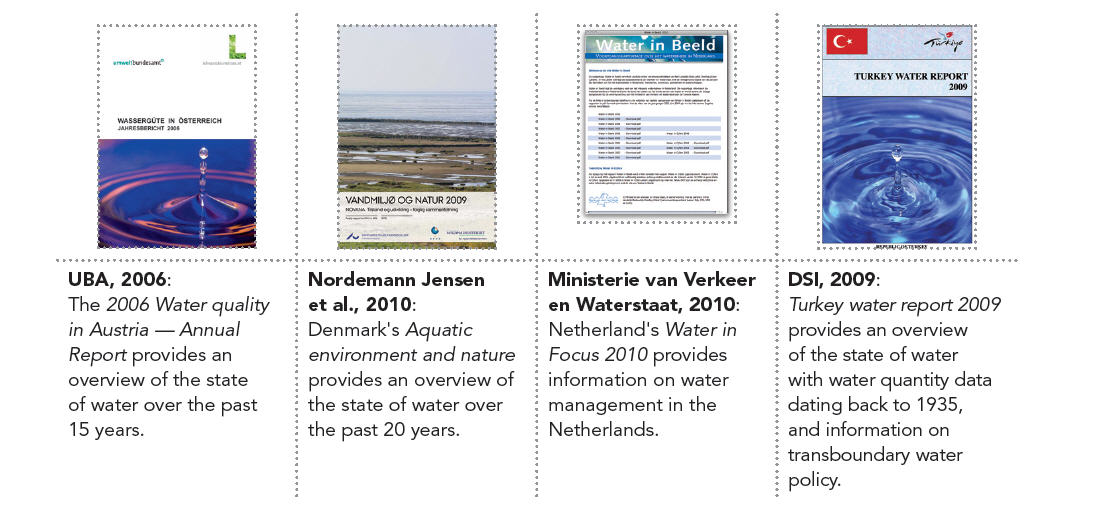
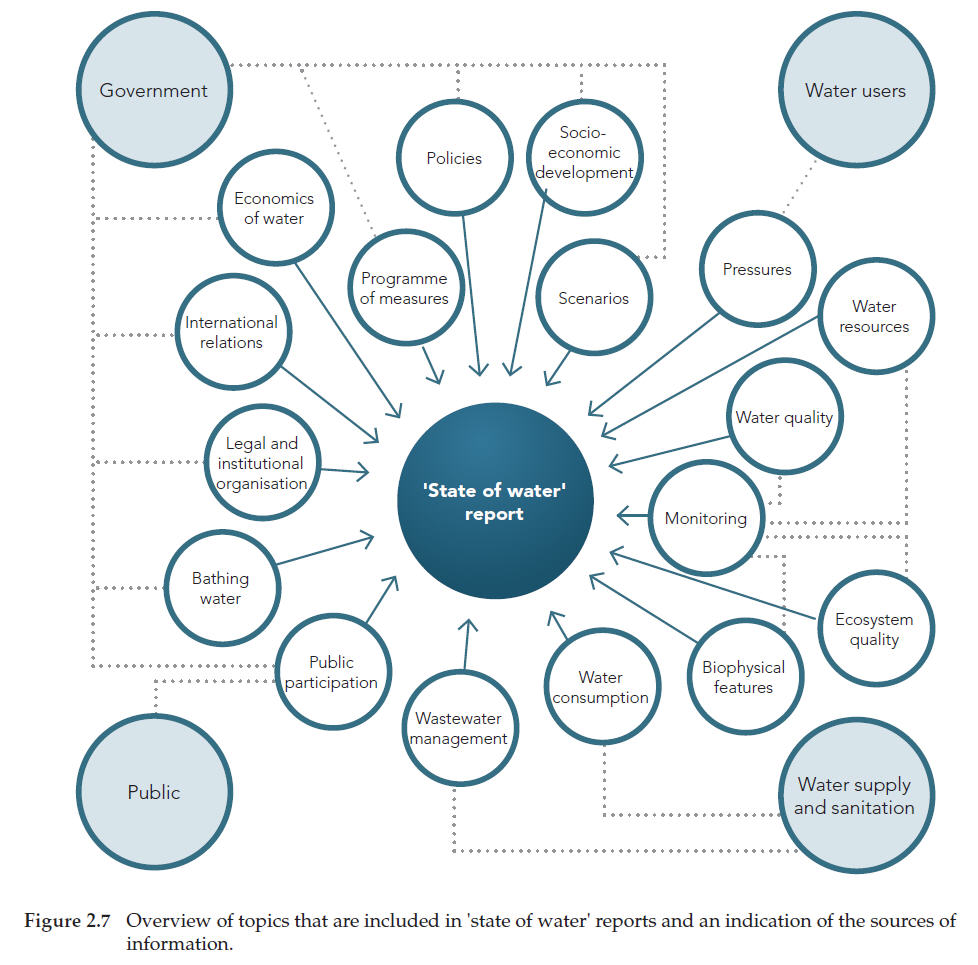
As shown in the above examples, the topics discussed in the various water assessments reports are diverse, depending on the water management situation in the respective countries. A range of issues could be identified that are included in these reports, but not every issue is discussed in every report. Figure 2.7 provides an overview of issues that are discussed in the 'state of water' reports as well as some sources of the information.
Most of the 'state of water' reports assessed for this report were published in recent years (2008–2010) reporting on data four years old and less. The size of the reports varies from some 20–30 pages through some 100 pages as in the case of the Czech Republic and up to 175 pages for Croatia. Water-management plans, including 'state of water' information, amount to some 280 pages (the Netherlands). However, increasingly 'state of water' reports are concise documents that contain condensed information while data are provided in separate reports — alongside the Netherlands' Water in focus, a separate volume Water in data was published — or through webbased applications. The water indicators used in the water assessments are usually subsets of the indicators used for SoE assessments.
2.3.5 Water statistics
Many countries also publish water statistics. These appear in the form of publications (Austria, Azerbaijan, Belgium, Bulgaria, Italy, Kosovo under UNSCR 1244/1999, Kyrgyzstan, Malta, Romania, the United Kingdom, Uzbekistan) or as statistical tables, made available through websites (Belarus, Bosnia and Herzegovina, Denmark, Estonia, Germany, Greece, Ireland, Liechtenstein, Lithuania, Moldova, Montenegro, the Netherlands, Norway, Poland, Portugal, Russian Federation, Serbia, Spain, Switzerland, and Turkey). Some of the statistical tables include downloadable elements as in the cases of Belarus, Portugal, Spain, and Turkey, or searchable databases available for the Netherlands and Romania, for example. Some countries, as Cyprus, Latvia, and Switzerland, require login procedures to access their statistical data.
Various industrial organisations and NGOs produce publications on water, such as on water supply and/or waste water treatment in Austria, Czech Republic, Denmark, France, Germany, Greece, Ireland, Italy, the Netherlands and Sweden; on energy in the Russian Federation; on nature conservation in Cyprus, Montenegro, Turkey and Uzbekistan; on governance in Kazakhstan and Tajikistan; on water pollution in Estonia; hydrological yearbooks for Austria, Czech Republic, Finland, France, Hungary, Norway, Slovakia, Slovenia and Switzerland; and on water regulations in Liechtenstein.
The water statistics often provide hydrological data and, increasingly, chemical parameters. Sometimes, when statistics are provided on line, real-time hydrological data are shown. By collecting information on a website, a data source is developed that can be used to produce water assessments. However, the water statistics are sometimes separated from the water assessment data.
2.3.6 Specific water thematic assessments
In addition to the general 'state of water' assessments, many countries produce reports on specific water themes — the Austrian Ministry of Agriculture, Forestry, Environment and Water Management, for example, lists about 130 publications on water on its website, the Danish Environment Ministry lists more than 200, and the Danish Environmental Protection Agency more than 1 000 that include water, and the Slovenian online library of the Environment Agency lists 227 titles when using the search word 'water'. Such reports provide more in-depth descriptions and detailed data and information related to the theme.
Many of these thematic reports, including hydrological yearbooks, annual reports on bathing water quality, biannual reports on developments in waste water treatment and drinking water quality, are part of regular reporting schemes.
Other regular publications include national reports related to water policies. Such reports include river-basin management plans, WFD Article 5 reports, reports related to the nitrate directive, the urban waste water treatment directive, the bathing water directive, the drinking water directive, and national communications to UNFCCC.
Additionally to these obligatory reports, some countries also perform studies and produce assessments on specific issues that are important for that country, or report on ad-hoc studies, such as Oil Spill in the Kerch Strait — Ukraine Post-Disaster Needs Assessment' (Ukraine) and Dioxine in bottom sediments in the Southern Part of Baikal Lake (Russian Federation) or specific assessments for the national part of individual rivers or lakes, for instance, Baseline Conditions and Pressures on for Integrated Water Resources Management in the Marmarik River Basin of Armenia (Armenia) or State of the environment of Balkhash Lake (Kazakhstan). As well as the water thematic assessments, water and water-related ecosystems topics are discussed in other thematic assessments, such as reports on climate change, biodiversity, or energy.
The above shows that the collected data and information is used for a range of assessments alongside general environmental assessments. Also specific data and information collection takes place to develop thematic assessments. Such specific information is, however, often not stored in a way that makes it accessible to a wider audience, let alone make it available for SoE or 'state of water' assessments. Such data and information run the risk of being lost after use in one or two thematic assessments.
2.3.7 Country water profiles
The EEA 'State and outlook 2010' report on the European environment (SOER 2010) included country assessments on different environmental issues including freshwater. Countries were responsible for producing these assessments of the status and pressures affecting their freshwaters. Overall, the activity of producing freshwater assessments was a success with 37 countries providing a freshwater assessment. These national freshwater assessments provide a good overview of freshwater issues relevant for the European countries.
Many international organisations provide water information by country (Annex 2.2) including country profiles and data fact-sheets providing an overview of country-specific water issues. The annex shows that all countries appear in one or more water assessments. It also shows that the information available at the international level is often rather outdated. For instance, the latest information collected by GEMS Water, which is used in the World Water Assessment Programme, is already six years old while much of the information is much older. To improve the assessments that are based on these datasets, updating of information is needed.
UNECE (19) and OECD (20) have made substantial efforts to produce environmental performance reviews to help countries upgrade their environment through improving policies, strategies and tools. Annex 2.3 provides an overview of the countries in the pan-European region involved in these reviews and the year in which the reviews were published.
Currently, international information collection is based on programme-specific questionnaires. As each programme uses its own format and asks for a different set of data, countries have started to suffer from questionnaire fatigue and are becoming less willing to provide their data to international programmes, even more so as these sometimes add little to national water management in terms of improved understanding of national water systems. As the available information for the international programmes becomes outdated, this effect increases. Innovative ways of data collection are therefore needed to improve the information that is internationally available.
2.3.8 Findings from the assessments
Some general developments can be found from the assessment of the various assessments as described in this section. These findings are described briefly here and will be further discussed in the following sections.
- Many different assessments are produced, often with different purposes. A general grouping is that of SoE assessments, statistical yearbooks, water assessments, water statistics, and thematic reports. Where the SoE and water assessments build upon the same information, the statistical yearbooks often provide different information. Thematic reports sometimes build on specifically collected information that is not made available for general assessments. These differences lead to redundant and sometimes wasteful information collection.
- The environmental status usually changes slowly. Assessments produced annually often report information that shows little changes over the years.
- There is a tendency to reduce the amount of information provided in an assessment by producing summaries and findings and by putting the background information on websites and online databases.
- The range and type of information reported is wide and varies between countries. Applying indicators that are internationally harmonised can help by reducing and streamlining the amount of information that is reported and in communicating between countries about the state of the environment (Smeets and Weterings, 1999). The use of indicators has increased over the last decade.
- International organisations also collect country information and produce assessments. These, however, run the risk of being outdated, as the information reported is often several years old. Streamlining of the national reporting with the international reporting would help to overcome this problem.
- Despite the broad topics included in SoE and water assessments, the analysis provided is seldom integrated across the different aspects of water. Mostly reporting is done on the separate aspects with some cross-reference if there are influences.
2.4 Highlights of water assessments
2.4.1 Type of analysis covered by the water assessments
A multitude of national water assessments is available
The information on water produced by European countries has markedly increased over the past 20 years, well documented by the information presented in the national freshwater assessments. For instance, the AoA portal review template contains 319 SoE and water reports from 48 countries covering the period 2005–2010. The increase in the production and dissemination as shown in Section 2.1.1 is due to an increased understanding that environmental monitoring and information systems are crucial for developing environmental policy. Over the years, many countries have developed or improved their systems to produce environmental information and, maybe even more importantly, have opened up this information to the wider public. International legislation such as the Aarhus Convention and the EU Directive on access to information has helped this process.
Much attention has been put into making the presentation of information inviting to the reader; the use of diagrams, graphs, charts and maps within the reports has much improved over the years. Moreover, the increased use of indicators has resulted in more targeted and compact information.
Nevertheless, producing factual, timely and easy-to-understand SoE assessments remains a challenge for several countries. In many cases the assessments are largely descriptive, being a compilation of different water issues with a strong focus on status and pressures. Indicators used are typically a selection from the available information. They, too, focus on status, pressures and impacts, and neither reflect the policy-relevant drivers, nor suggest responses. Only limited information on policy performance, water management, implementation of measures, new challenges, etc. is provided, although this information is imperative to make the information useful for decision-makers. As the information is consequently not presented in an integrated manner, decision-makers consider the assessments only partly useful at best.
Many European and regional water assessments are produced
At both the global and European scale a multitude of inland water assessments is available. In many ways, Europe is leading the way in producing water assessments. The AoA virtual library, for instance, contains more than 110 regional and European SoE and water reports for the period 2005–2010. The increase in European water assessment is partly driven by the 15-year tradition of EEA in producing water assessments, supplemented with water assessment activities by OECD, UNECE, and WHO (focusing on water supply and sanitation) and water statistics produced by Eurostat and OECD.
The EU water policies, including their reporting obligations in relation to the WFD and the implementation of other water policies, such as the urban wastewater treatment, nitrate, bathing water and drinking water directives, also require relevant assessments on the status and pressures affecting the EU waters.
The OECD and UNECE environmental performance reviews have, since 1992, developed and improved the assessment methodology in the region. This was also done by the WHO Regional Office for Europe that, since 1999, has produced country health-system profiles (HiTs) as part of the European Observatory on Health Systems and Policies. These profiles provide a detailed description of health systems and of policy initiatives, in progress or under development, including water supply and sanitation.
Finally, the establishment of Transboundary Water Commissions (see Box 2.6 for an overview) that produce assessments for the waters under their mandate helped in developing a solid knowledge base on water assessments. Despite this experience, many of the European and regional assessments are not always based on up-to-date and available information.
Timeliness of information
The timeliness of water information has improved over the last ten years; often the data and information in the water assessments are only a few years old. However, for some countries many water indicators are based on old data, in some cases more than 10 years old. Regional and international assessments have even more difficulty in collecting and using timely information where countries take time to provide the necessary information.
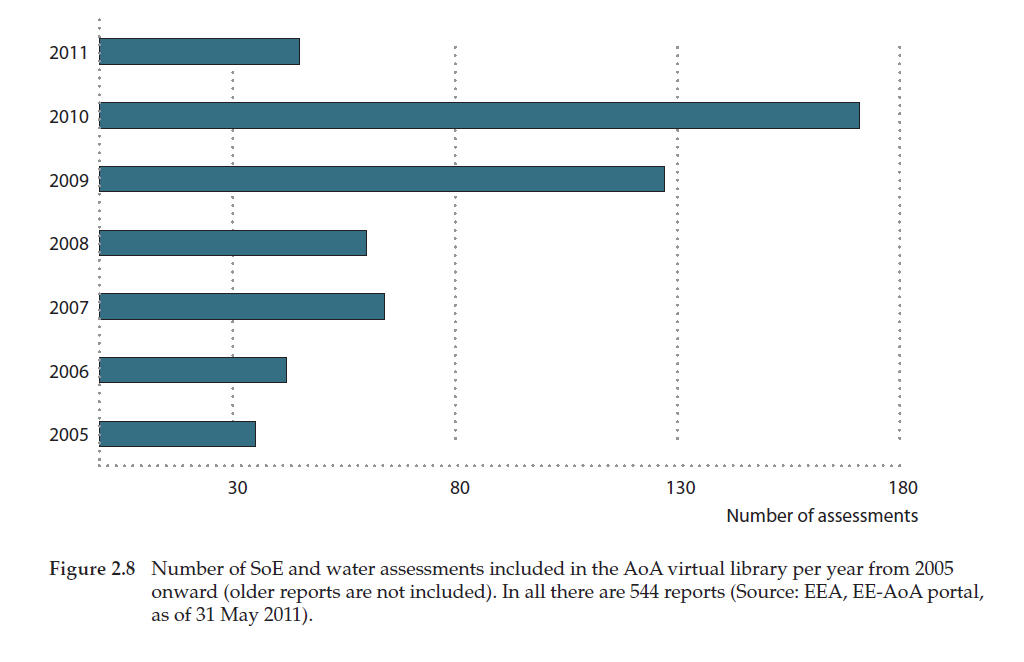
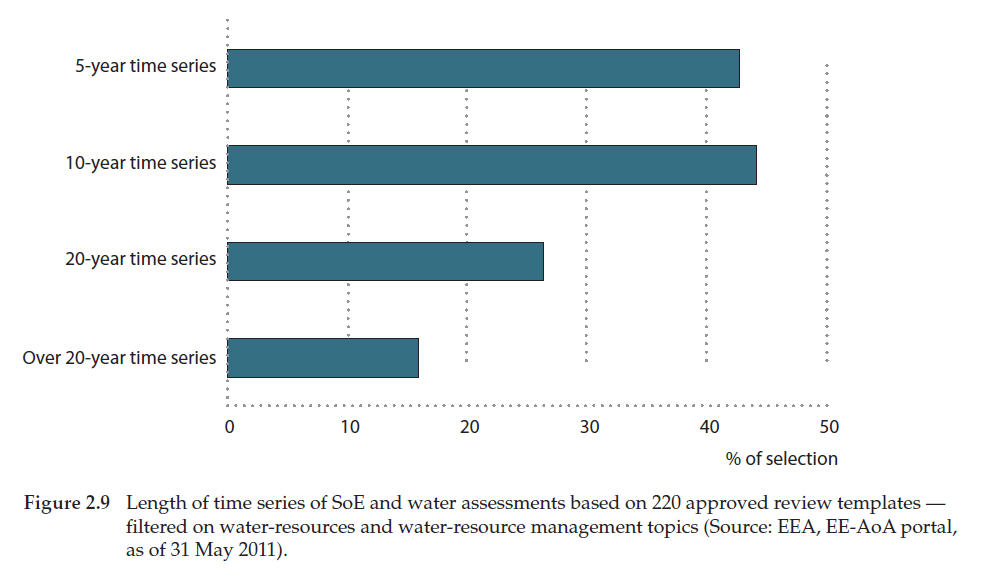
Some countries have regular updates of SoE water chapters and environmental/water statistics, often annually and often as part of the national legislative requirements. For instance, in Resolution No. 53 of 1993, the Government of the Russian Federation has stated that the SoE report 'should act as ground for a more precise definition of priority areas of environmental protection activities and programmes directed to improvement of the environmental situation in the Russian Federation'. Reporting cycles range between one and four years, using relatively recent information. Figure 2.8 shows the number of assessments included in the AoA virtual library from 2005 onwards (older reports are included in the virtual library, but not considered in the figure). The figure shows that most of the assessments were produced very recently. The time-series included in the assessments range up to over 20 years (Figure 2.9).
Regular assessment cycles are beneficial. It is important to keep the information up-to-date, to sustain and improve its quality, through regular evaluations and updating of the information production process (Timmerman et al., 2010a). The iterations also allow for the development of information procedures that will improve the quality of the information (e.g. Timmerman et al., 1996; UNECE, 2006; Ward et al., 1990). However, the policy relevance of environmental statistical yearbooks could be questioned as, usually, there are only minor changes year on year.
Coverage of freshwater issues
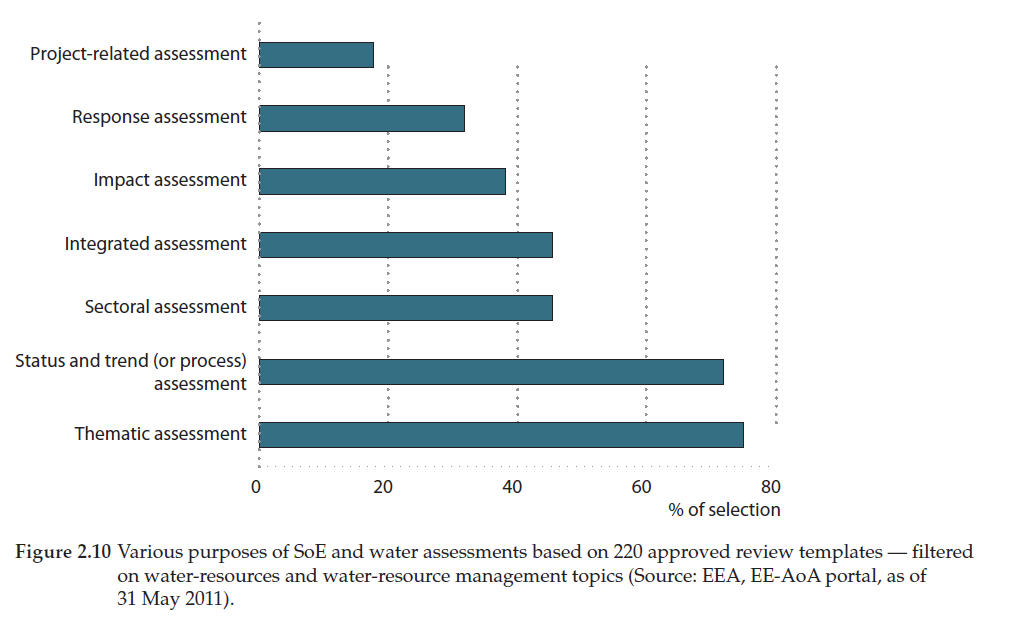
Depending on the country some freshwater environmental issues are more important than others and therefore the focus of the assessment varies between the countries. Figure 2.10 shows the various purposes of the reports in the AoA review. The figure shows that status and trend assessments and thematic assessments take the largest shares, followed by integrated and sectoral assessments.
Looking at the thematic priorities listed in Box 2.2, it appears that all topics are included when all assessments are taken into account. Figure 2.11 shows the number of reports in which individual elements are discussed. It also shows if these themes are discussed from a policy perspective, a legal perspective, if it discusses trends or hot spots, and if transboundary aspects are discussed. The numbers are averaged over the various sub-themes under one theme. In general, policy issues as well as legal issues on the themes are included in the assessments. Trends are important parts of the assessments; hot spots are included a little less and transboundary issues are least discussed. Of the themes, the ecological state is least discussed. In view of the title and subject of this chapter, looking at water and water-related ecosystems, improvement of this situation is needed.
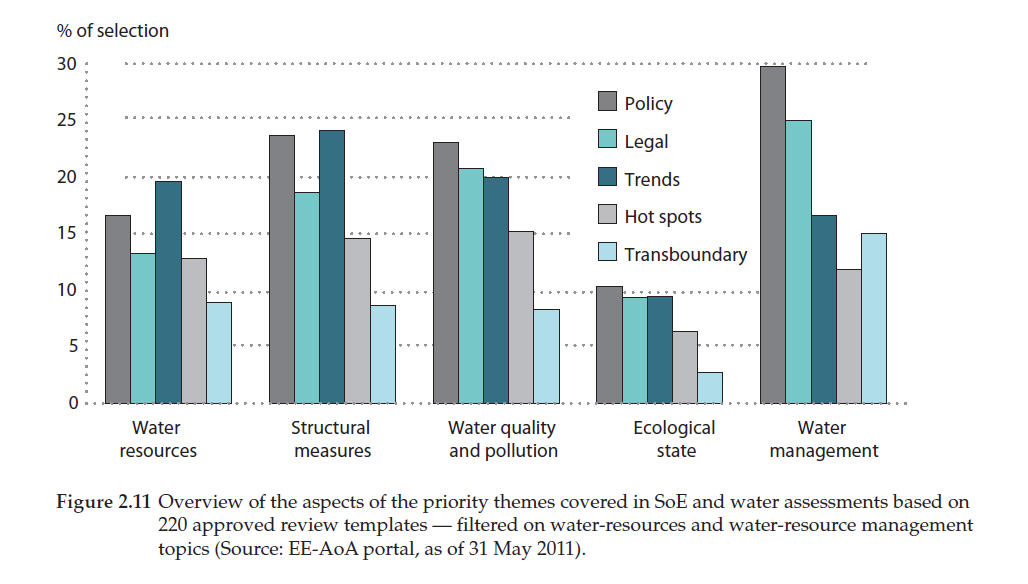
Within these themes, there is a difference in what sub-themes are discussed and how they are discussed. The traditional issues are included, but there is much less coverage of new issues:
- nearly all countries cover water quantity (water availability and water demand) and water quality, including water pollution, in their assessments;
- structural measures and ecological status are least discussed;
- vulnerability, for example, is not much discussed, nor are ecosystem services and restoration.
As this lesser attention to new issues may be due to a lack of knowledge, regional assessments can provide support. With the available knowledge, it should be possible to develop indicators and methodologies for such assessments on a regional level to give an overview of the situation. Countries can then use these regular assessments to improve their policies, but also to collect better information that, in turn, leads to an improved understanding of the national situation.
Little attention is given to transboundary issues. As many water management issues have a transboundary aspect, this is a clear omission, possibly due to lack of information from neighbouring countries. Regional assessments and exchange of information between countries could help to improve this situation. One of the few exceptions in this regard is the UNECE Convention on the protection and use of transboundary watercourses and international lakes in the UNECE region which focuses specifically on transboundary waters.
Data/information coverage
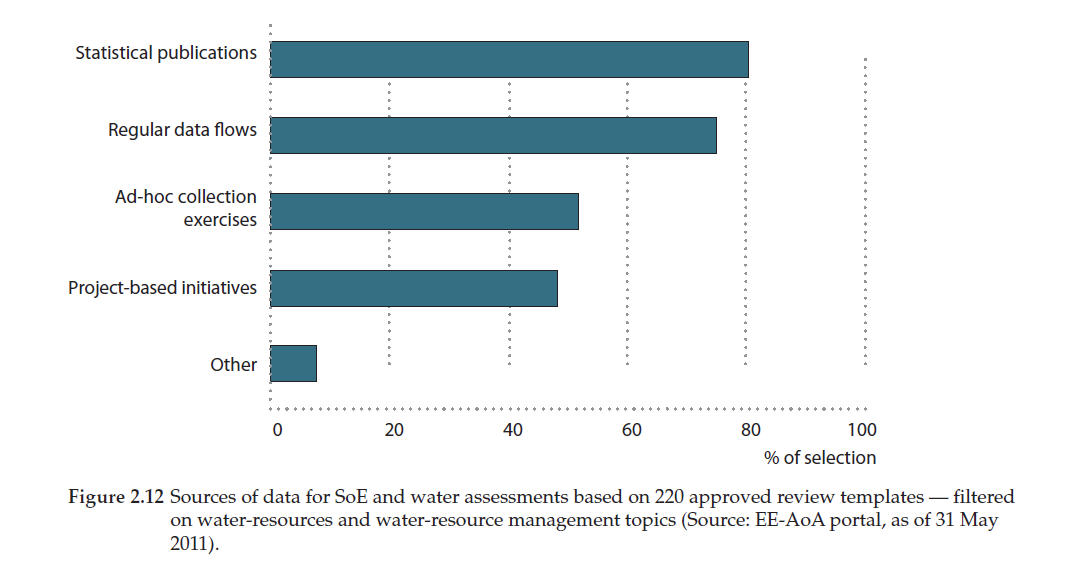
Figure 2.12 shows the various sources of data that are used for SoE and water assessments. The figure shows that statistical information is used in over 80 per cent of the assessments, regular data flows account for more than 70 per cent. Other sources are ad hoc collection exercises and project based initiatives. This shows that various sources are used for the assessments.
Information gaps were identified in almost half of the assessments. For instance, a review of assessment reports in the Eastern Europe countries found that some 29 per cent of the information needs could not be met either due to a lack of information or insufficient access to information. The gaps include:
- lack of or poor quality of data;
- lack of longer time series;
- lack of knowledge on analysis methods and tools, cost benefit analyses, water-quality monitoring, etc.;
- lack of financial resources;
- lack of harmonised procedures for international water bodies;
- lack of biological monitoring and groundwater monitoring;
- lack of legal acts or contradictions between existing legal acts;
- differences in the interpretation of the observations and lack of documented methods; and
- only 20 per cent of the assessments had an information system to support data management, data sharing, and/or data exchange was used.
All these issues hinder the analysis of trends and comparability of data, both between countries and within countries (see also Landsberg-Uczciwek and Zan, 2004).
Moreover, the capacity of both personnel and infrastructure to produce integrated assessments is limited and varies widely across the countries, and relates to the above-mentioned gaps. From this listing it becomes clear that the data and information collecting systems are not always sufficiently implemented. Additionally, working across national boundaries poses specific challenges to making assessments and different interpretations of existing data. Internationally coordinated activities could help reduce these problems.
Using a structured procedure to develop assessments is necessary if these are to be legitimate and credible. This entails issues such as having consistent time series of data, having representative data, both spatial (river stretch, lake area, etc.) and temporal (seasonality), together with harmonised sampling and analysis strategies, and proper data management. Peer review of assessments should be part of the quality procedures. Approximately 60 per cent of the assessments had been reviewed or put out for public consultation before publishing.
While all countries report about general water quantity and quality issues such as nutrients and heavy metals, little reporting was found about newer issues including hazardous substances, impacts of water scarcity and drought, or water management such as water pricing.
Information chain for policymaking
Over these years there has been a growing awareness of the importance of involving decision-makers and stakeholders in setting objectives and defining the scope of assessments and in targeting them as the recipients of the resulting assessments. In many assessments however, the link between the assessment and decision-makers is weak. The monitoring and data collection results are, to varying extents, reported to decision-making bodies and made available to the general public and the international community but the assessment objectives are often not clearly articulated and only a few assessments include analyses of future policy options, their potential outcomes and risks in a given situation. Moreover, linkages between socio-economic activities, status and trends, and measures that, especially when supplemented with possible futures, are most informative for decision-makers, are missing from most assessments. In the draft AoA report for the Russian Federation, for example, it explicitly says that while the status and impacts are reported, no assessment is made of possible measures and their impacts.
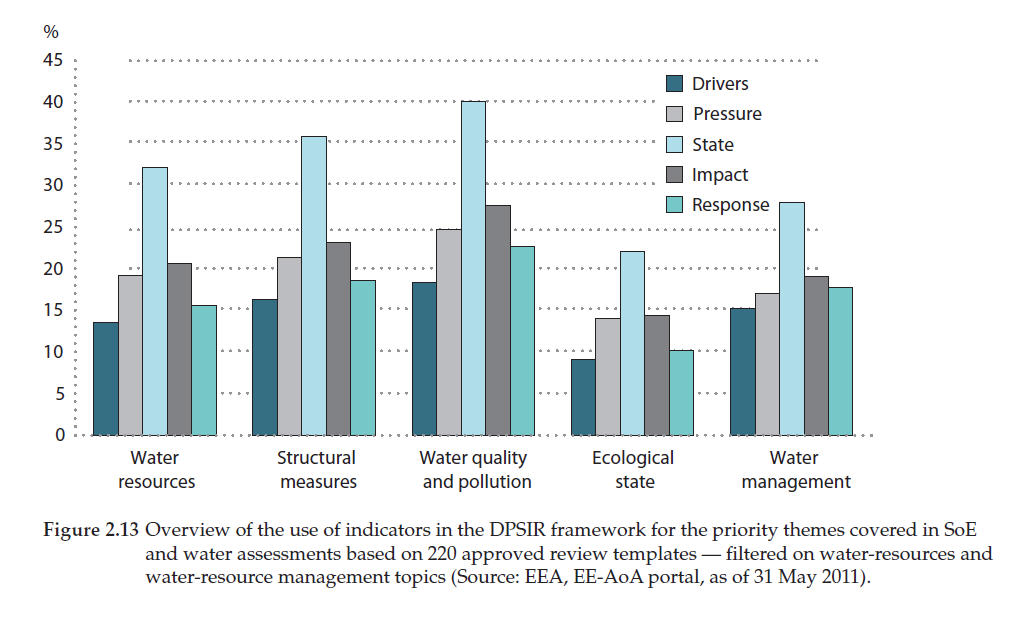
Some progress has been made, mostly due to the establishment of regular SoE reporting and the production of environmental statistics. Partly helped by these developments, especially the first SoE reports, countries have made progress in improving public access to environmental information. The spreading use of the DPSIR assessment framework, that provides a methodology for an integrated analysis and sets international standards, and indicators to compare status and trends internationally and over time underpin these developments. Figure 2.13 shows the use of indicators from the DPSIR indicated framework used for the SoE and water assessments as derived from the information contained in the AoA review templates The figure shows that overall state indicators are used most, pressure and impact indicators are used much less, drivers and response indicators are used least. The use of the indicators is rather evenly distributed over the priority themes; most information is provided on water quality and pollution, at least on the ecological state.
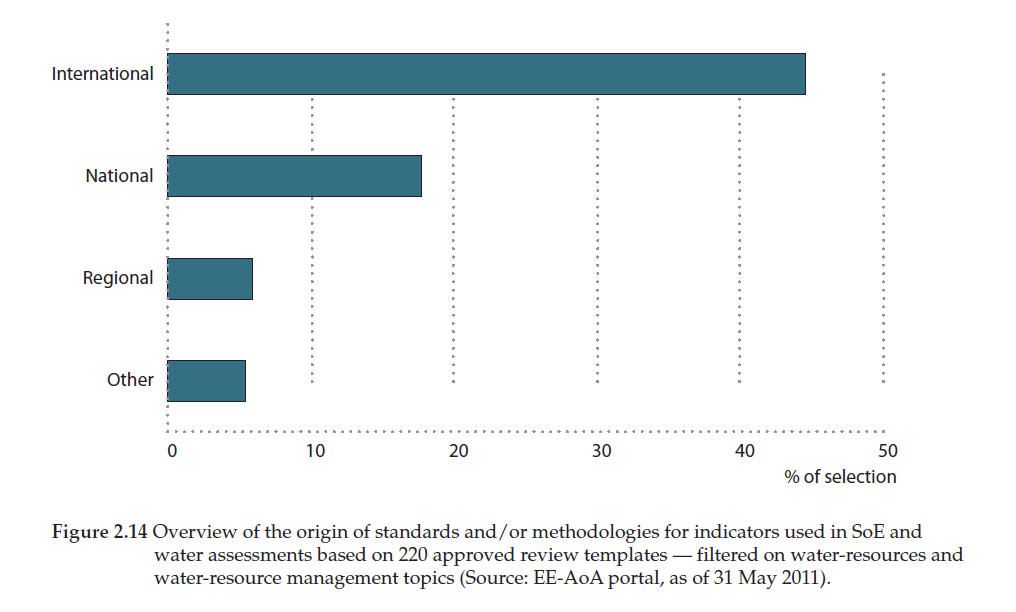
Fifty-three per cent of the indicators used in assessment reports are produced on the basis of standard/agreed methodologies and another 20 per cent is partially based on such standards and/or agreed methodologies. These standards and/or methodologies mostly originate from internationally agreed approaches while only a quarter of the methodologies have a national origin (Figure 2.14).
The widespread use of international standards and methodologies for indicators is important to improve the assessments. However, the assessments still largely focus on status, pressures and impacts, while little information is provided on the activities that cause the pressures or on water-management measures, let alone information on the water-management objectives or the level of implementation of water-management measures. There is limited evidence that the findings of the water assessments have ever been used in environmental policymaking.
Integrated assessments
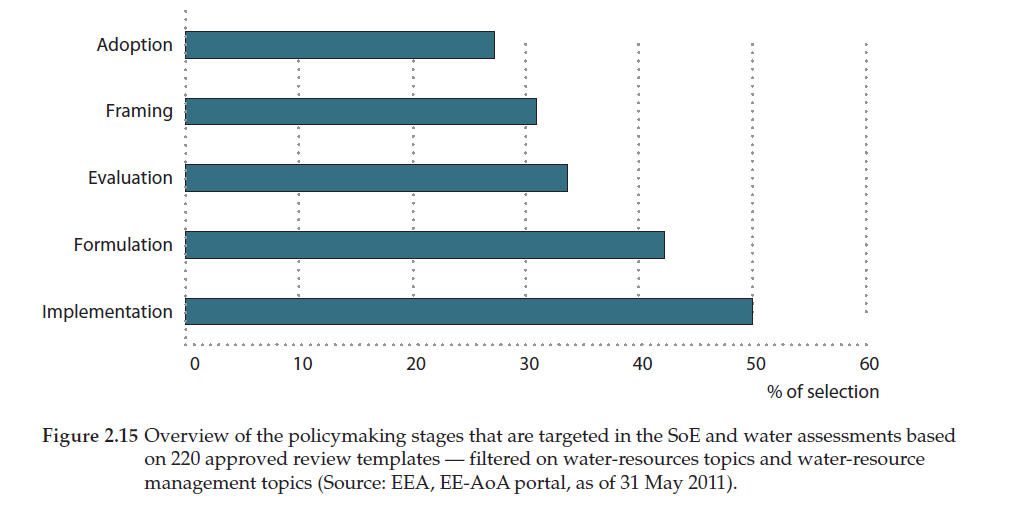
Assessments should not only cover the status and trends in the environment and in pressures on the environment, but also the status of implementation of (inter)national policies and measures in the area of environmental protection as well as integrate over various disciplines (Timmerman et al., 2010b). Some improvements over the years are visible. The information presented in assessments has changed from only presenting the status of a few basic parameters on a limited number of locations to presenting status, sources, effects and policy measures on a much wider range of parameters, making them much more integrated. Also, the various stages in policymaking are addressed by the assessments (Figure 2.15).
Nevertheless, in many assessments only limited information on policy performance, water management, implementation of measures, new challenges etc. is provided. Moreover, modelling and scenario tools, that can be very helpful in producing policy-relevant information, were only used in some 21 per cent of the assessments. As a consequence, little information is provided to policymakers on possible future effects of the policies.
The design of an integrated assessment process will be helpful in raising awareness (Timmerman et al., 2000) and will improve the assessments' perceived relevance, legitimacy and credibility (UNEP and IOC-UNESCO, 2009). Capacity to develop the modalities for such a process is available at international level. For instance, Guidance is available from the European Commission (EC, 2003) and from UNECE (UNECE, 2006). Moreover, by producing regional assessments similar to the EEA SOER 2010, international organisations can, in cooperation with countries, set directions and standards for assessments, thus providing examples and support to countries that struggle with these processes. Regional assessments as produced by international organisations like EEA, OECD and UNECE, consequently help developing capacities in setting a standard and providing methodologies.
By mandating international organisations to develop integrated assessments, such organisations, with the support of countries, can work towards improving the integration. This is done by supporting data and information collection across various sectors, setting database standards that include the countries involved. Selection of indicators is helpful in this respect as it focuses on a limited amount of information which is helpful when resources are limited.
If assessments are produced in cooperation between countries and international organisations (EEA, UNECE, etc.) it would also imply more cross-referencing of the results. European results could be used by countries in their national assessments and case studies and national examples could be more used in European assessments. Country and international cooperation on assessments could also be supportive in reducing the range of sources from which data and information is currently derived.
Moreover, regional and international assessments can be helpful to improve the information on ecosystems.
Finally, international assessments help in developing a regional view of water management, which, from the river basin management perspective, is an important but often overlooked aspect. International assessments provide for a view on the river basin level and help in harmonisation across administrative borders. Countries could find substantial support from such assessments.
Linking national information to European level
The analysis presented in the previous sections shows that many water management issues that are important at the national level are related to similar issues that are important at the European level (Figure 2.16). Most data and information is collected by countries for national action/implementation, but this information is also relevant at European and global level. Therefore international water assessments are not always based on the information and knowledge available and accumulated nationally.
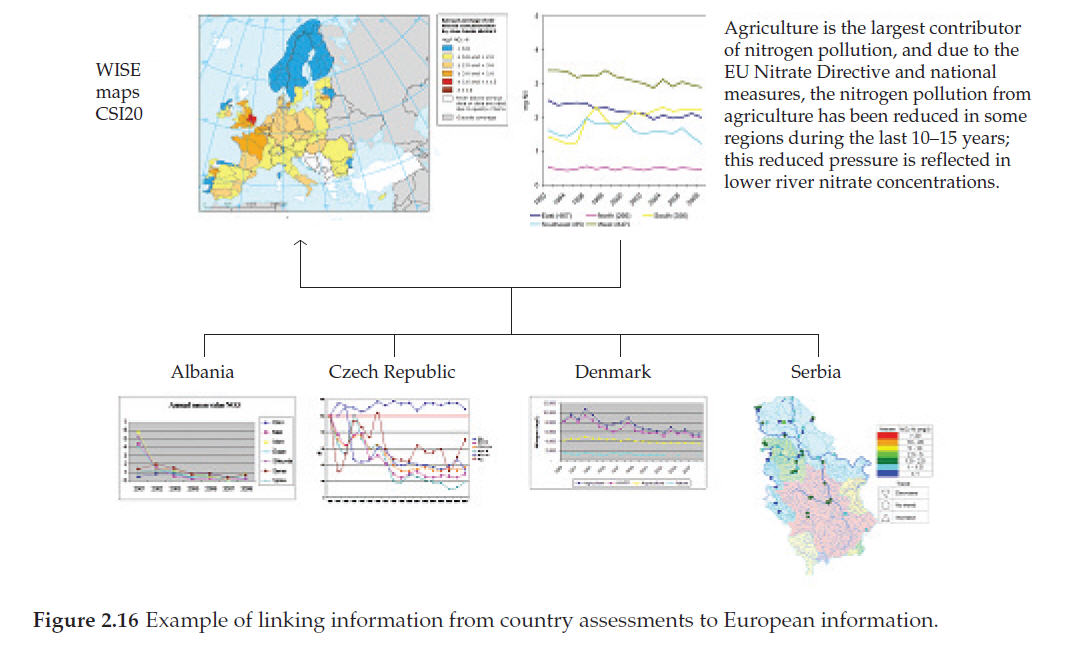
In the future a better data and information supply from the national water assessments to European assessments has to be ensured. The current data flows from national to European level only cover a part of the information needed and do not take sufficiently take stock of the results that come from national water assessment. By improving the access to national assessments and data, European water assessments would be based on the more specific and detailed information that is available at a country level. Moreover, the timeliness of the data and information used at the European level could be improved. An improved procedure to ensure the access of information is needed for this.
Figure 2.17 gives an impression of how a SEIS-based system could function. The benefits of such an approach lie not only at the European level, but also at the national level. The strategic objectives of the SEIS are:
- to improve the availability and quality of data and information to design and implement environment policy in the region;
- to reduce the administrative burden on countries and institutions and modernise reporting;
- to foster the development of information services and applications that all stakeholders can use and profit from.
To achieve this, the information should be managed as close as possible to its source, be collected once and shared with others for many purposes, be readily available and easy accessible, enable users to make comparisons at the appropriate geographical scale, be available to the general public at national level in the relevant national language(s), and be supported through common, free open software standards.
Table 2.1 gives an overview of how European assessments could be improved by a SEIS-based system in which the data and information were available at their (national) source, where results from national assessments were directly used, and in which national and European assessments cross-reference between each other.
While SoE assessments at the national level are sometimes well-elaborated, their quality varies substantially between countries. Also, while the legitimacy and credibility of many assessments is sufficient, in most cases their relevance is limited. Regional assessments could improve national assessments, but often lack the detailed national information that is available in the country. To improve this situation, a consistent common approach and close cooperation between international and national organisations is needed. The following priority challenges need concerted attention and have to be explored and discussed in the coming years:
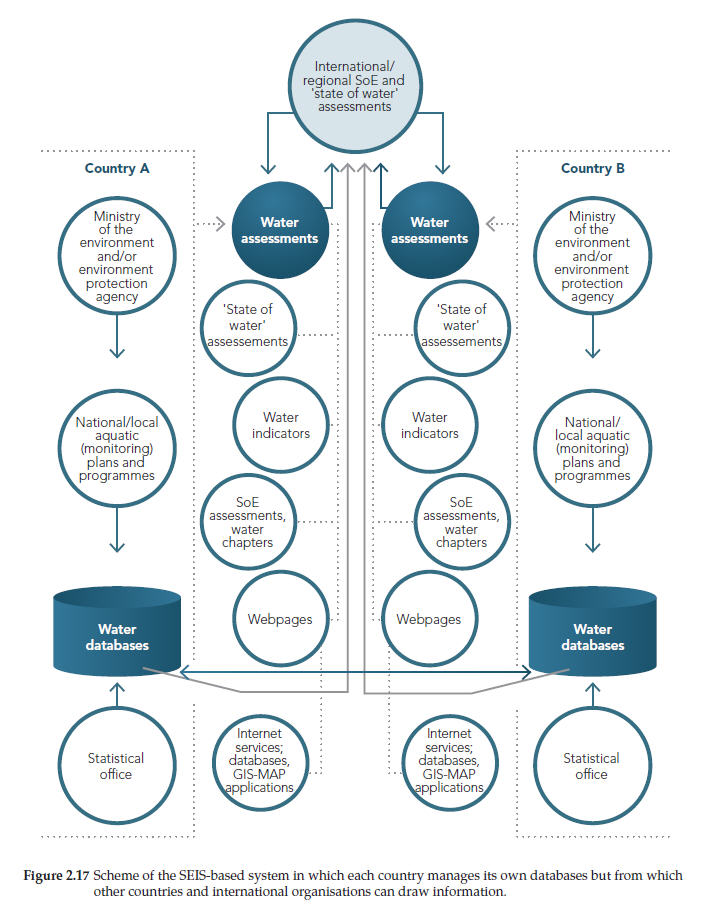
- ensure that assessment processes are well designed and structured, preferably harmonised on an international level, and clearly link them to policy processes;
- ensure that assessments contain information beyond status and trends and include integrated, policy relevant information. Development and promotion of a comprehensive set of indicators by international organisations, such as the DPSIR indicator framework as promoted by EEA, could support such improvements;
- ensure that data and information are accessible and comparable by harmonising databases on an international level so that assessments can be extended and scaled up or scaled down between national and regional levels. The Water Information System for Europe (WISE) is a good example of such a harmonised system (21).
- ensure improvement of ecosystem assessment by providing relevant indicators and support to countries in producing ecological information through international organisations;
- ensure that institutions are mandated to perform integrated assessments. Mandates should be given to EEA and UNECE to continue their work on regional assessments;
- EEA and UNECE should be mandated to support the development of capacities within countries to enable the implementation of procedures and methodologies for integrated assessments.

2.4.2 Priority concerns, specific needs, emerging issues, options for future action
From the assessment of SoE and water assessments, a range of issues that play an important role in water management in various countries emerges, with each country having its specific priority concerns. These range from more technical problems of water storage or purification to institutional issues, including the implementation of international agreements such as WFD or the UNECE Water Convention, the development of bilateral or multilateral river-basin agreements, and coordination between institutions. Several countries have problems with water shortage ranging from maintaining wetlands to a shortage of drinking water and water for irrigation.
An estimated 120 million people in the pan-European region do not have access to safe drinking water and adequate sanitation (WHO/UNICEF, 2010). As a result, they are more vulnerable to serious water-related diseases. Climate change is expected to aggravate this situation. Progress has been made over the past 15 years, especially for vulnerable populations and those living in rural and remote areas in Eastern Europe, the Caucasus and Central Asia. Many of the national assessments provide limited information on drinking water quality and management of drinking water. Examples of national assessments information on drinking water quality are listed below:
- Information on drinking water quality in the UNECE EPR for Uzbekistan from 2010: 'The current quality of the country's water resources remains extremely unsatisfactory, resulting in the increase in morbidity rate (kidney disease, oncological and acute infectious diseases), and adult and child mortality rates' and 'Given that main water streams can no longer be used as sources for drinking water supplies, adequately providing the population with good quality fresh drinking water is one of the country's most serious problems.'
- UNECE EPR for Kazakhstan, 2008: 'The drastic under-investment in the maintenance of all water infrastructure since the 1990s is a matter of increasing concern. Eighty per cent of infrastructure is obsolete in some of the major cities, and the inter-oblast distribution network has even collapsed in some areas. Since the Programme on drinking water and the Programme for rural development were adopted in 2002 and 2003 respectively, State funds have been increasingly spent on rehabilitating drinking-water infrastructure (increasing from approximately USD 5 million in 2000 to USD 200 million in 2007).'
- Ministry of Health, France, 2008: 'Quality of drinking water in 2006, Key figures: 310 000 samples taken under the sanitary control; 96 per cent of samples comply with the bacteriological criteria; 98 per cent of controls on nitrate in accordance with regulations; 97.7 per cent of controls on lead in accordance with regulations and 99.3 per cent of controls on fluoride in accordance with regulations.'
- UBA Umweltdaten, Germany, 2009: 'The data reflect an overall good to very good quality of drinking water in Germany.'
Water quality in most parts of Europe has improved in the past 20 years. This is due to better regulation, enforcement and investment in wastewater treatment plants, mainly in Western Europe. In the Eastern Europe, in addition to these, the economic transition since the early 1990's has helped. Moreover, throughout the region production has become cleaner, resulting in a decrease of pollution from industrial facilities. These statements are supported and described in more detail in European assessments:
- EEA SOER 2010 (EEA, 2010c): Freshwater quality thematic assessments: Implementation of the urban waste water treatment directive, together with comparable non-EU legislation, has led to improvements in wastewater treatment across much of the continent. This has resulted in reduced point discharges of nutrients and organic pollution to freshwater bodies.
- EEA SEBI16: Pollution of rivers with oxygen-consuming substances and nutrients is decreasing. This reduces stress on freshwater biodiversity and improves ecological status.
Most of the national water assessments in the EEA area have information on trends in water quality and pollution sources, while the information on inland water quality and pollution sources is more scattered in Eastern Europe, the Caucasus and Central Asia.
- Information on wastewater treatment in the UNECE EPR for Uzbekistan from 2010: 'Although the in-stream disposal of public-utility wastewater has been decreasing in recent years, the purification rate is not sufficiently high. The low operating efficiency of wastewater treatment plants results in an increased concentration of pollutants in surface water streams and depression reservoirs.'
- UNECE EPR for Kazakhstan 2008: 'The eight River Basin Organisation's (RBO's) transmit information on quantities of water used to the Committee on Water Resources, as was done in the past, but provide limited information on water quality and corrective measures. National water management authorities therefore do not have sufficiently detailed information to develop coherent national policy.'
- Environmental Indicators, Slovenia, 2007: 'The levels of pesticides in groundwater have been decreasing, but in the flat lands of Slovenia (the basins of the Drava and Mura rivers), for which intensive agricultural activities are typical, these levels are still exceeding the quality standards.'
- Environmental Indicators, Flemish Region, Belgium, 2010: 'In the course of the last two decades the biological quality of the Flemish surface waters has improved slowly but surely. The percentage of measurement locations with an extremely or very bad quality decreased significantly and the percentage with a moderate or good quality increased significantly. The positive developments are the result of the expansion and improvement of the public waste water treatment system and the efforts made by companies and agriculture.'
International legislation, together with international implementation programmes, has helped countries to improve their water management and as a result improve their water quality situation. Assessment systems are in place to identify the status and trends. As however water management has become more complex, more sophisticated assessment methodologies are needed to assess the issues and the effectiveness of water management. Also here, guidance from the international level can help countries to improve their assessment, both in terms of methodology as well as from viewing the information from neighbouring countries.
2.5 Conclusions and recommendations
The analysis of SoE and water assessments has revealed a multitude of products, containing a wealth of information. At the same time, the analysis also revealed that much information is lacking and the policy relevance of the information is weak. This is not only true of national assessments but also regional ones.
In general, the regular assessments help to improve the quality of the data and information. An important flaw in many of the assessments is that they are generally rich in statistical data but are of limited use in relation to state-of-water assessments and policymaking. To improve this situation, an enhanced process is needed that supports integrated assessments and that ensures exchange of data and information.
Improve the process
The assessment process involves setting objectives for the assessment, collecting relevant data and information, analysis and aggregation of the data and information, and disseminating the results of the analysis. Issues to be dealt with in improving the process include enhancing the capacity of personnel and infrastructure, upgrading data and information collection, developing and improving integrated analyses and strengthening the links to water policy. Both European and national assessments would benefit from a closer co-operation between European organisations (EEA, UNECE and others) and countries in improving this process by supporting the harmonisation of the process and methods across the countries. INSPIRE has already supported harmonising data management. In the coming years a data exchange system, with direct access to information/assessments stored at national and river-basin levels, compliant with the SEIS principle that information should be managed close to its source is being developed. This system will, amongst others things, ensure that, through the shared water assessment system, there is access to relevant national assessments which can be used for up-to-date European assessments. The direct access may reduce data reporting and transfer costs and ensure that there is access to disaggregated data.
Support integrated assessments
Assessments are currently over-restricted to environmental status and trends. What is needed are assessments that take an integrated approach to water issues. Especially from the river-basin management perspective, information from different countries and authorities needs to be combined. Indicators help in simplifying the communication between the different issues. The DPSIR indicator framework helps to reduce efforts for collecting data and information by focusing on a few elements. It also helps in making data comparable between institutions and countries because they are well defined. Also, including ecological information in the integrated assessments is supported in this way. Finally, it provides the structure to connect the various elements and make assessments more integrated.
Ensure exchange of data and information
Over the past 20 years, the availability of data has increased substantially. More and more, countries open up their databases for public access for reasons of accountability and trustworthiness. Where countries increasingly change to providing information through web-based databases, the procedure of the international programmes collecting information through questionnaires becomes obsolete. The SEIS principles enable a situation in which national and regional assessments can be developed with up-to-date information and without deviations between the numbers. The quality of assessments will be improved through this approach, while the ownership, especially of regional assessments, will be better shared between the international organisation and the countries involved. Moreover, the individual countries will benefit from the information coming from neighbouring countries.
To improve future assessments, based on the findings from the analysis carried out in this study, it is recommended to work towards more integrated assessments. These provide information about the status and trends but also provide future outlooks based on policy options and directions. It is also recommended to improve the sharing and exchange of data and information through improved access to such resources. This exchange should be based on the SEIS principle that the data and information is managed as close as possible to its source. EEA, UNECE and international organisations should be mandated to further develop this approach. Through this mandate and in close cooperation with the countries they are able to:
- improve the data and information production process in the region, inter alia through frequency of data and trend assessments (for prognoses and foresight in a broader sense);
- promote and enhance the exchange of data and information in the region and enable and improve assessments on the river-basin level, inter alia through joint collection of quality and quantity data;
- improve the integrated character of the assessments by providing standards, approaches and methodologies to combine data and information from different sources, inter alia through WFD classification;
- improve policy-relevance of assessments in order to support better decision-making, inter alia through collection of information for strategy development;
- improve ecological assessments by supporting indicator development and ecological information production.
8. UN-Water, UNEP, World Water Assessment Program, UNESCO, IPCC, OECD, UNECE, etc.
9. As endorsed by the Steering Group of the AoA.
13. EEA member and cooperating countries.
17. National sets of environmental indicators were found for Armenia, Azerbaijan, Belarus, Belgium, Bulgaria, Croatia, Czech Republic, Denmark, Estonia, Finland, France, the former Yugoslav Republic of Macedonia, Germany, Greece, Hungary, Iceland, Ireland, Italy, Luxembourg, Malta, Moldova, the Netherlands, Norway, Poland, Portugal, Russian Federation, Serbia, Slovakia, Slovenia, Spain, Switzerland, Ukraine, and the United Kingdom.
18. Armenia, Belarus, Belgium, Bosnia and Herzegovina, Croatia, Czech Republic, Estonia, Finland, the former Yugoslav Republic of Macedonia, France, Ireland, Italy, Kazakhstan, Kosovo under UNSCR 1244/1999, Kyrgyzstan, Luxembourg, the Netherlands, Poland, Serbia, Slovak Republic, Sweden, Ukraine, the United Kingdom.

Document Actions
Share with others