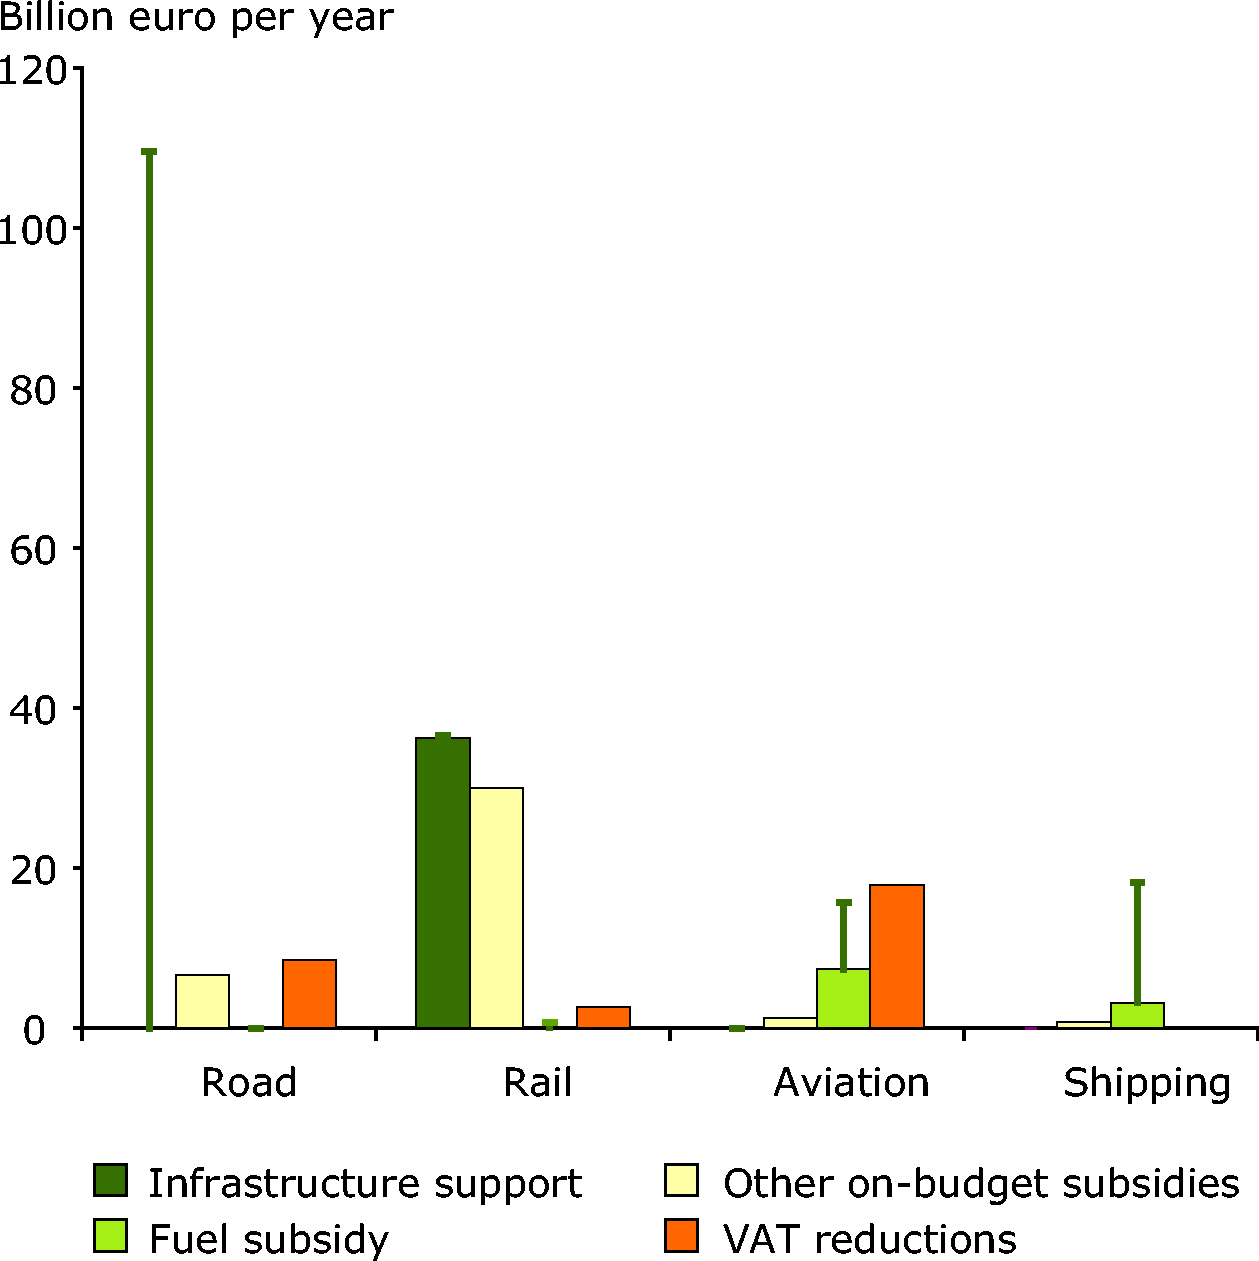
The upper band (109) represents infrastructure costs minus direct charges (e.g. Eurovignette) while the lower band represents infrastructure costs minus all transport related charges. As such it is less an uncertainty on the number, but rather on how to interpret the numbers. Further discussion on this issue will be published with an EEA report on transport subsidies due out in spring of 2007.
The range in estimates is due to varying approaches to estimate infrastructure support and fuel subsidies. This table is based on incomplete data; the total value of transport subsidies remains unknown. This note must accompany any use of this table.
Data in euro of 2005 for EU25 (except for infrastructure data which refer to EU15). On budget subsidies are based on an inventory of existing studies for various years. Data were processed to obtain estimates of on-budget subsidies per year, in Euro of 2005. The estimates for infrastructure support are calculated with infrastructure costs and charges based on data from UNITE (aviation and shipping data are excluded because data for these modes are incomplete). The estimates for subsidies by fuel excise duties exemptions have been calculated using the average ETS price of EUR 20 as a reference value. For rail estimates are high for the excise duty exemptions compared with this reference value, because of lack of data on rail diesel excise duties. Exemptions in electricity taxes for rail transport are not included The estimates for subsidies by VAT exemptions have been calculated using standard VAT rates of the various countries as a reference value.


Document Actions
Share with others