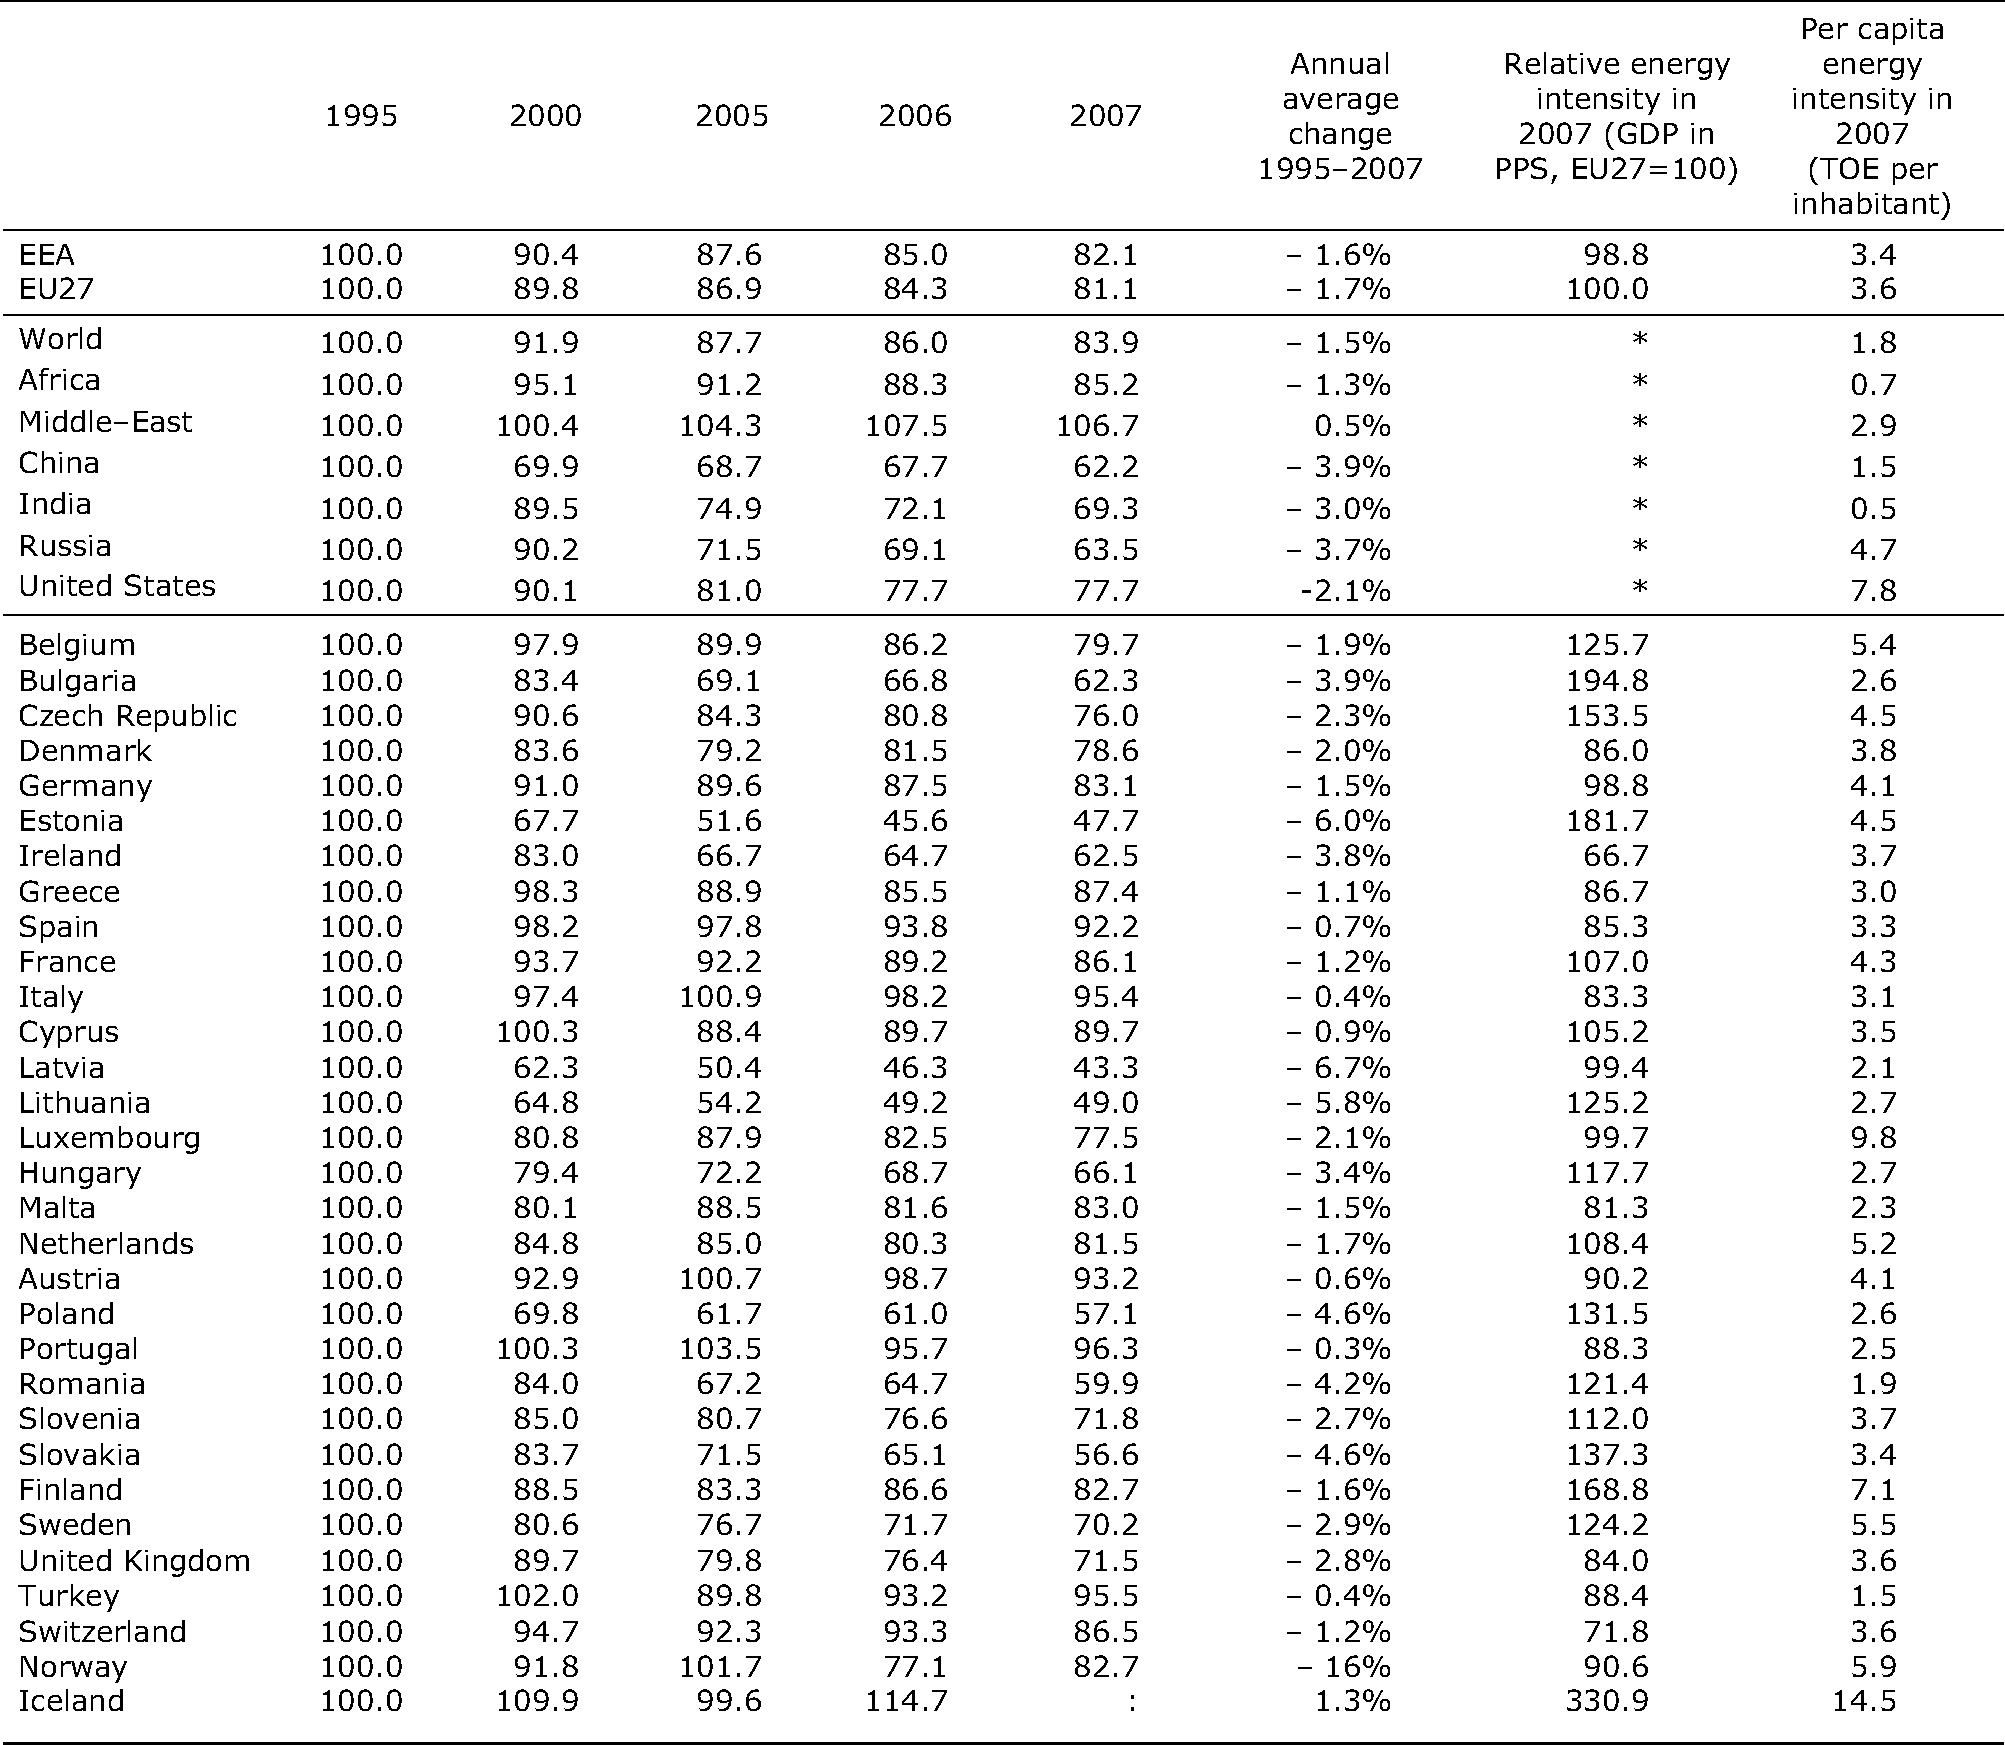
Also include information for Estonia, World, Africa, Middle-East, China, India, Russia and United States.
The year for the reference index value is 1995 because GDP was not available for all EU countries in 1990. The second last column shows the energy intensity measured in purchasing power standards relative to the EU-27. These are currency conversion rates that both convert to a common currency and equalize the purchasing power of different currencies. They eliminate the differences in price levels between countries, allowing meaningful volume comparisons of GDP. They are an optimal unit for benchmarking country performance in a particular year. The growth rate and intensities in Iceland are based on 2006 data. Purchasing power standard estimates of GDP were not available for the non-EU countries.
No data was available from the United Nations Statistics Division for the World and Qatar. For Qatar and the world data from the IMF is used. Also no data was available from the United Nations Statistics Division for 2007, the data was estimated with the IMF data. See metadata for further details.


Document Actions
Share with others