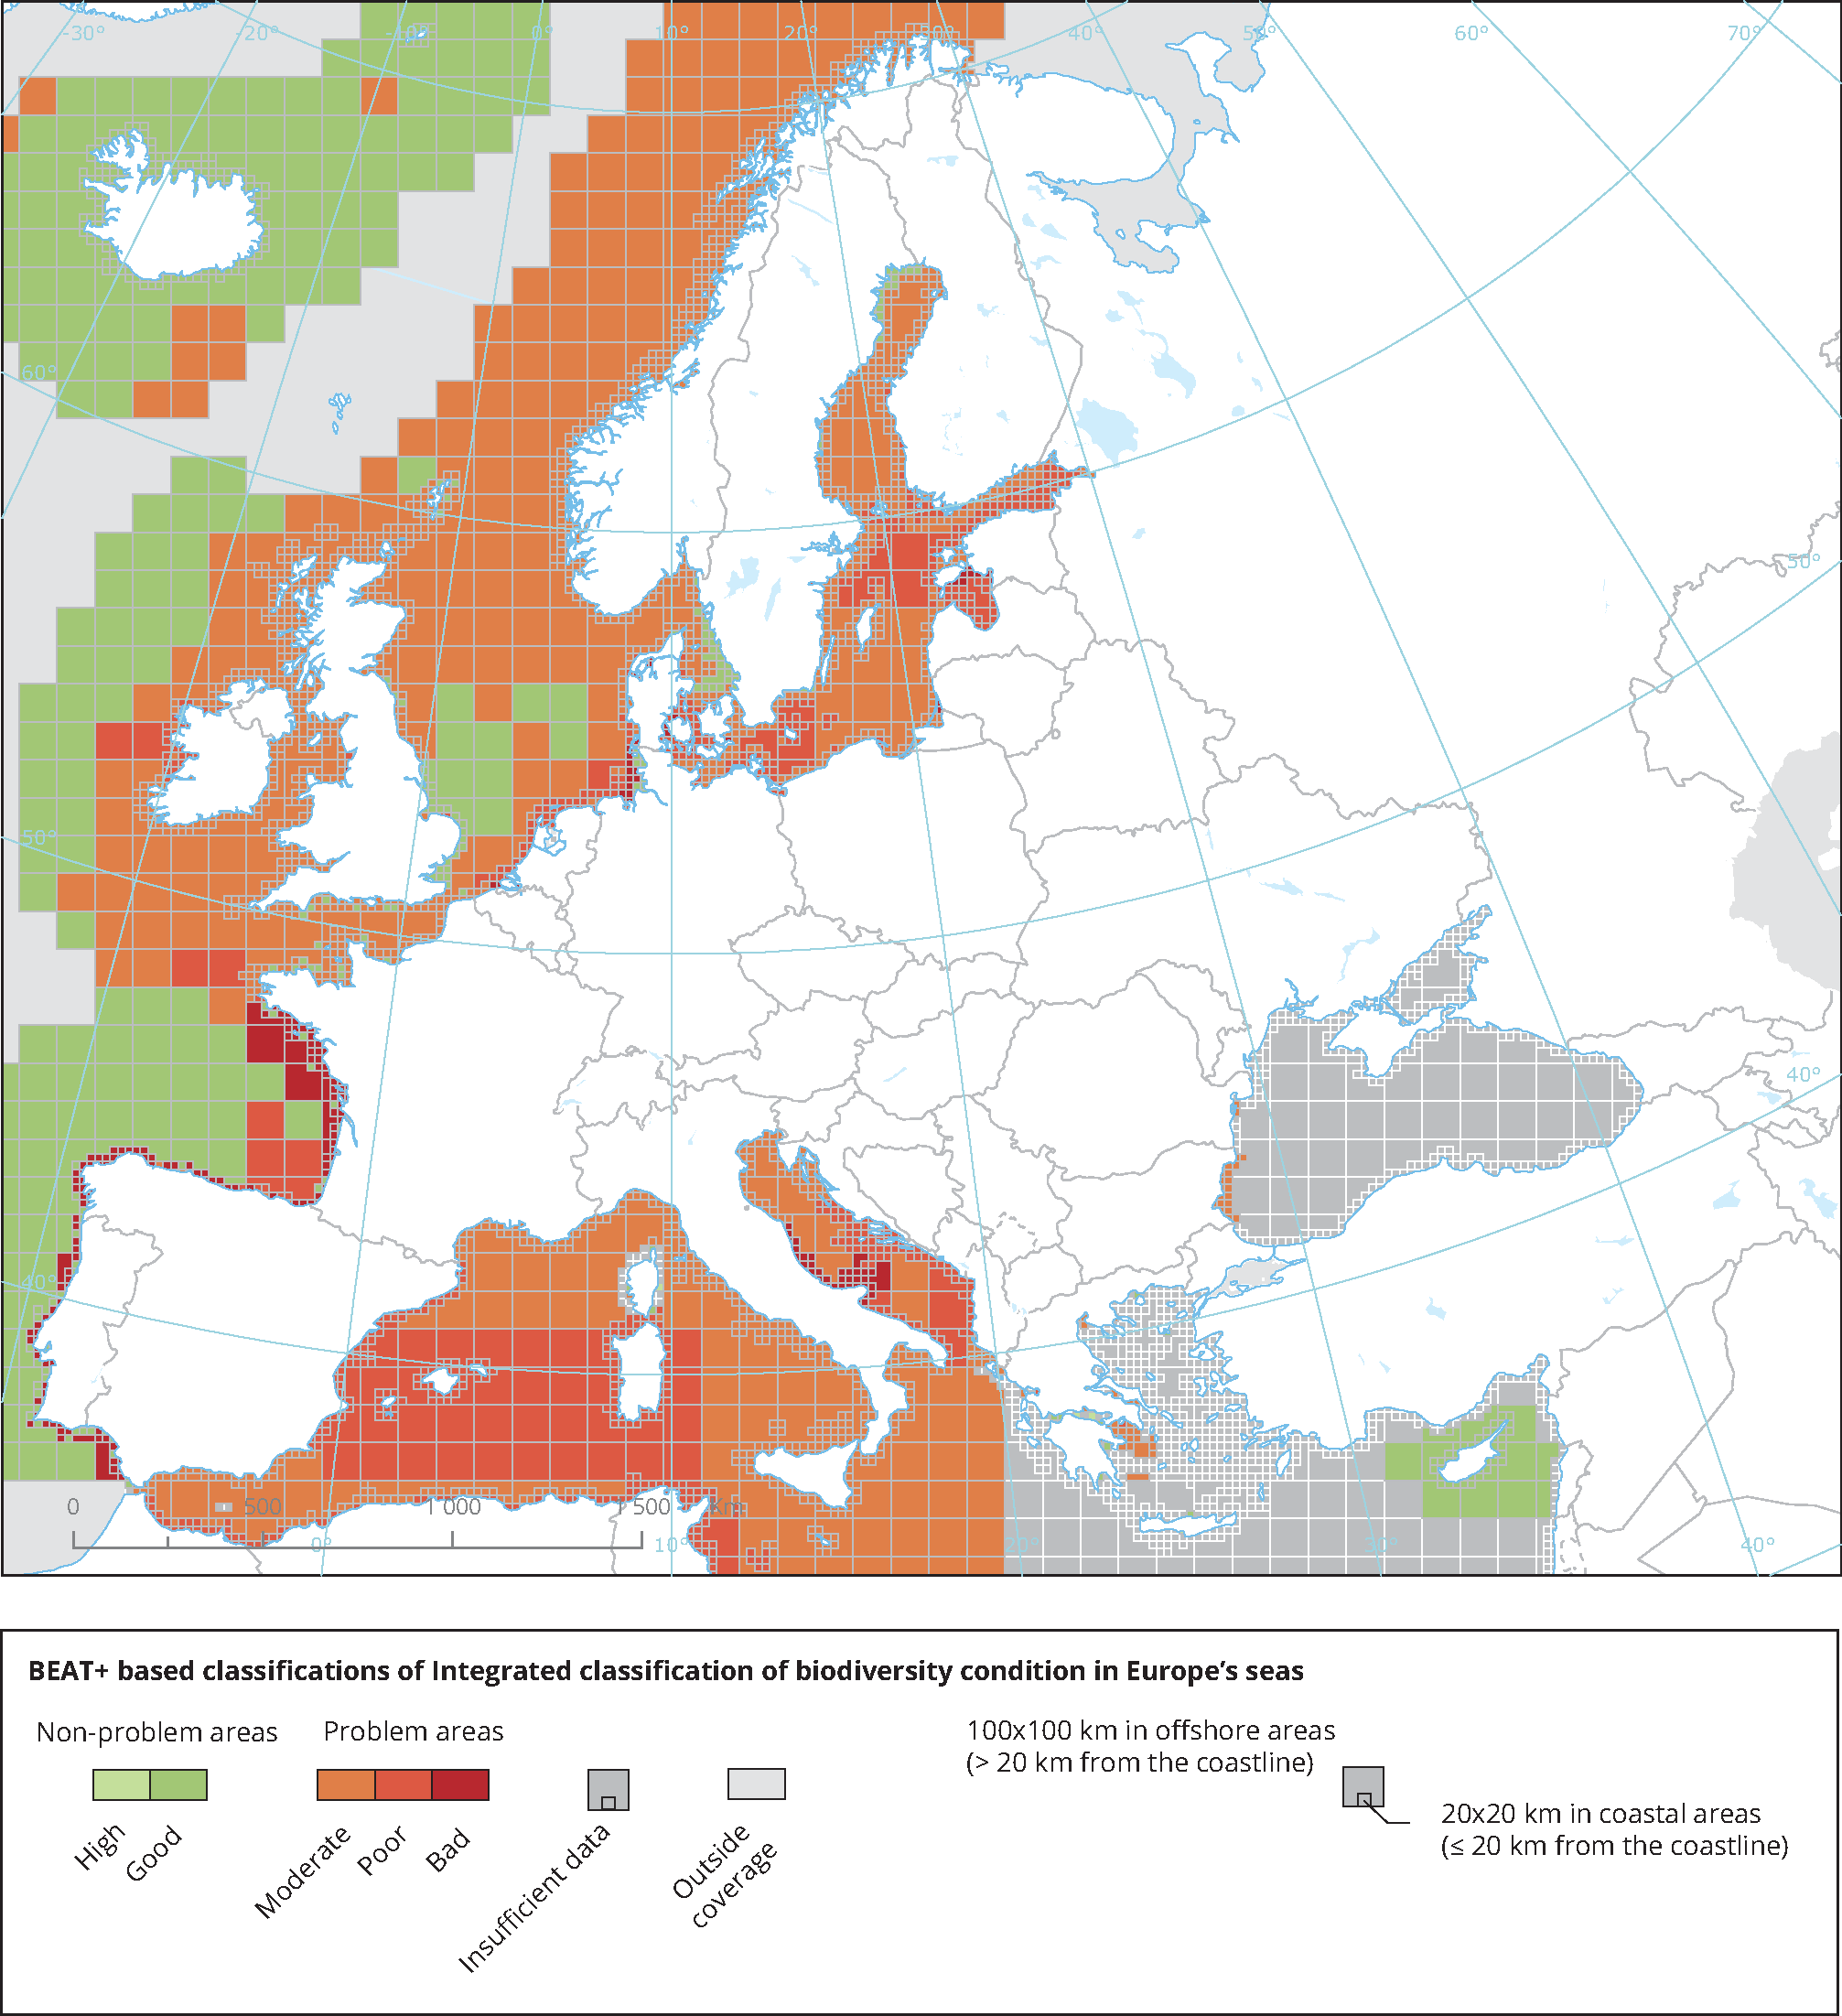
BEAT+ has been designed to provide an assessment of the spatial variability of a range of biodiversity components by combining existing biodiversity indicators
Marine messages II has developed, tested and applied a new multi‑metric indicator‑based assessment tool named 'European Marine Ecosystem Condition (Health) Tool' (MESH+). The MESH+ tool builds on the EEA assessment tools developed and applied in the context of assessing the degree of contamination (CHASE+), eutrophication (HEAT+) and biodiversity (BEAT+) in Europe's seas (EEA, 2018a, 2019c; Vaughan et al., 2019). MESH+ makes use of the same data sets and threshold values used in these assessments but recombines these in a new framework that addresses 'ecosystem condition'.

 taken in account for the measurement values(s) of the data resource.")
Document Actions
Share with others