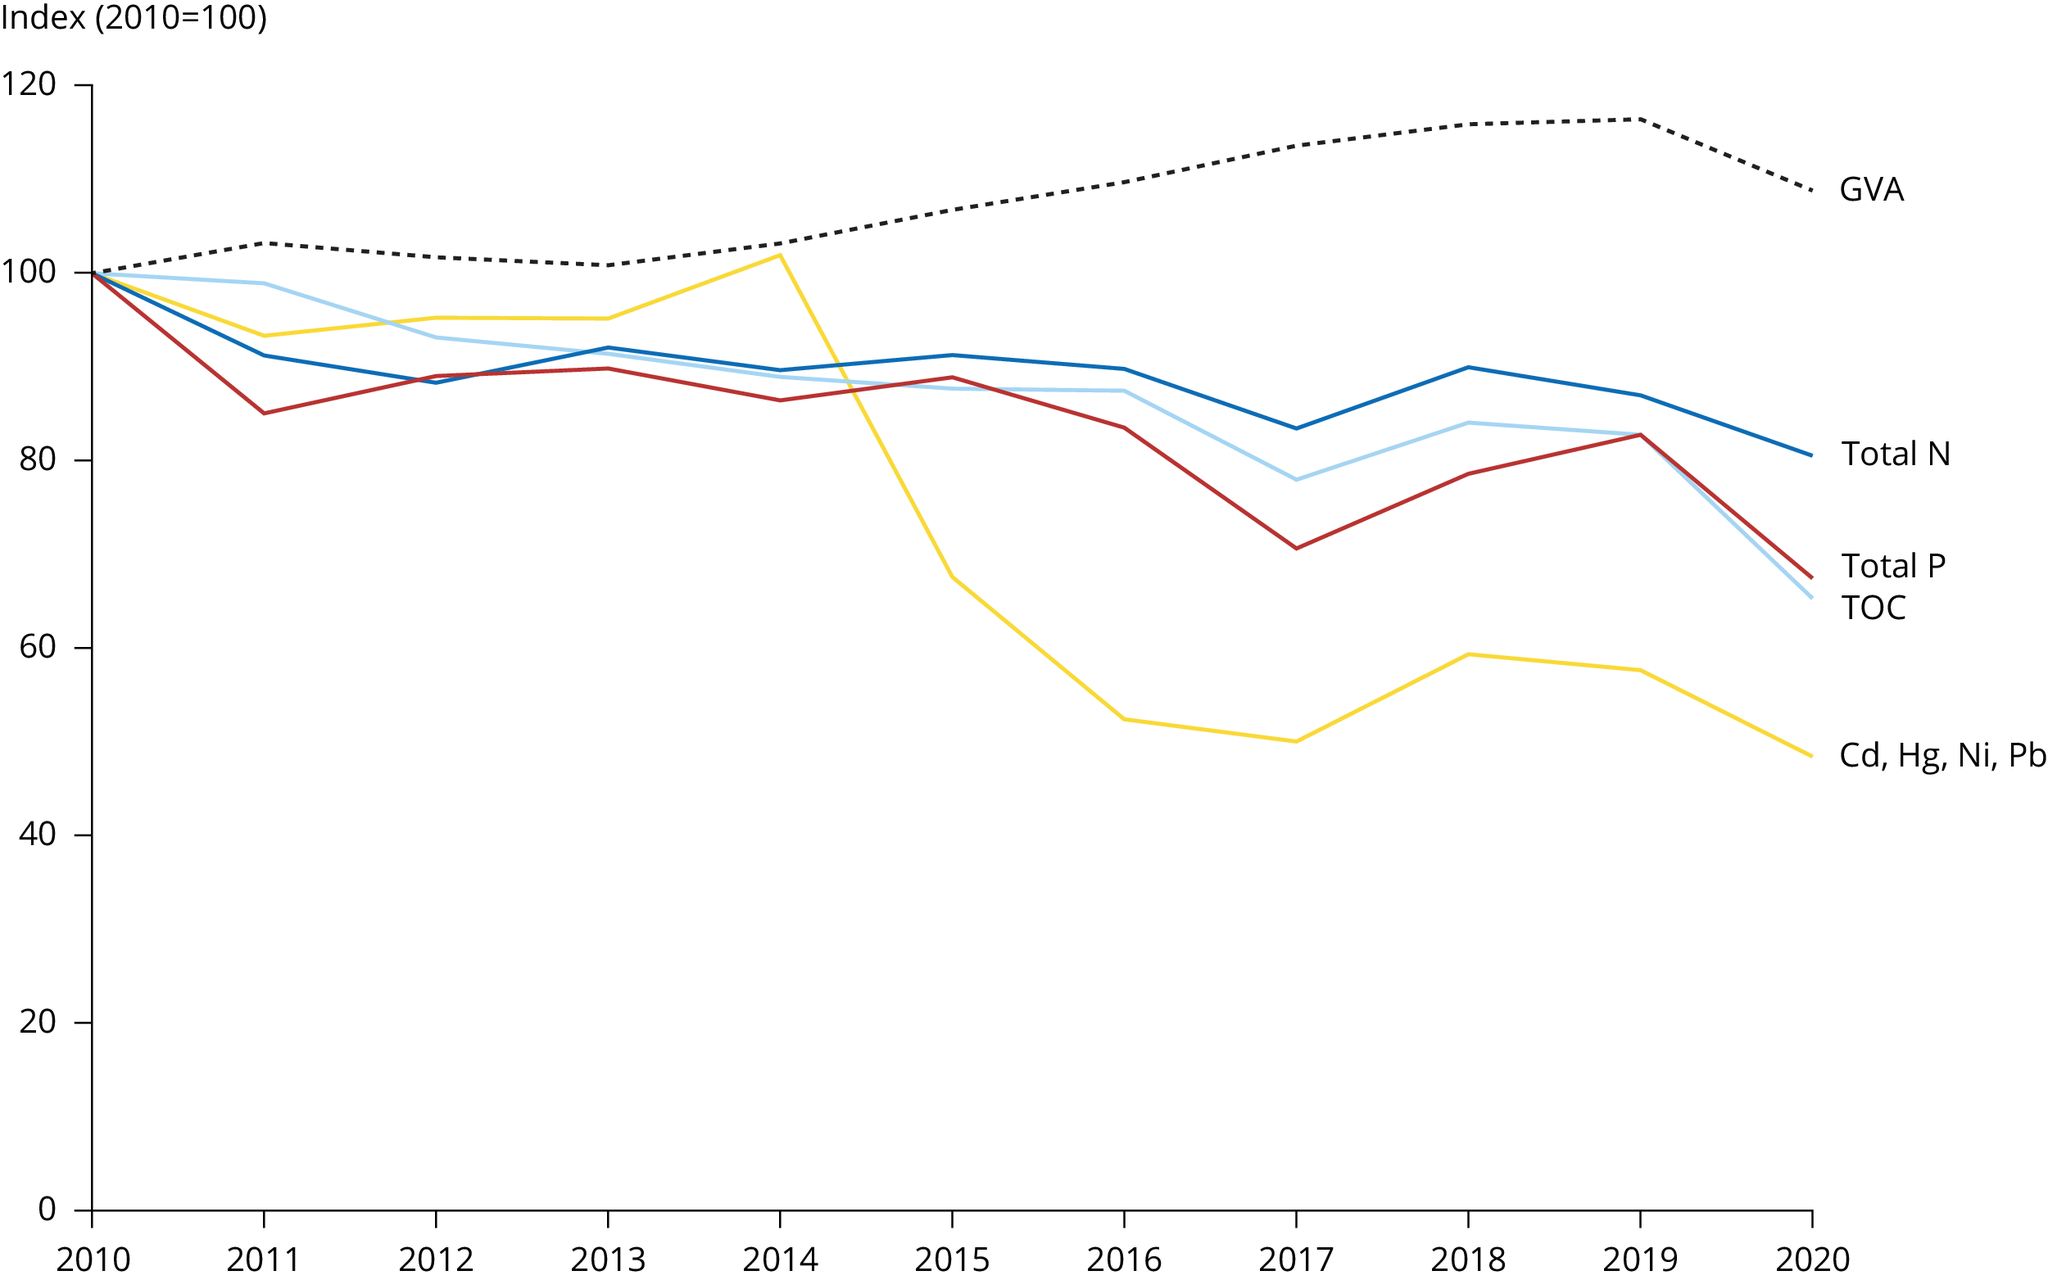
GVA - gross value added, TOC - total organic carbon, Total N - total nitrogen, Total P - total phosphorous, Cd - Cadmium, Hg - Mercury, Ni - Nickel, Pb - Lead. GVA is used as a proxy for the economic activity of industry in Europe, accounting for inflation, based on 2010 values. Releases are described in terms of their TOC content, which indicates, in an aggregated form, their contribution to eutrophication, among other detrimental biological processes
Slovakia - did not report under new E-PRTR: data from 2016 projected in 2017-2020
Germany and Lithuania-lack of reporting from 2017. 2017 data used for the period 2018-2020
Italy and Malta-lack of reporting 2020. 2019 values has been used
Spain-Nickel correction. Mistake in use of comma separator for 2019. Corrected value
Portugal-Cd correction Mistake in use of comma separator for 2018. Corrected value
Italy-TOC correction 2015 TOC value reported with high degree of uncertainty. 2014 value used.


Document Actions
Share with others