The distance to ceilings was calculated based on unadjusted emissions.
The NEC Directive does not include 2010 ceilings for PM2.5. The EU’s 2020 and 2030 reduction commitments are calculated relative to 2005 base year emissions.
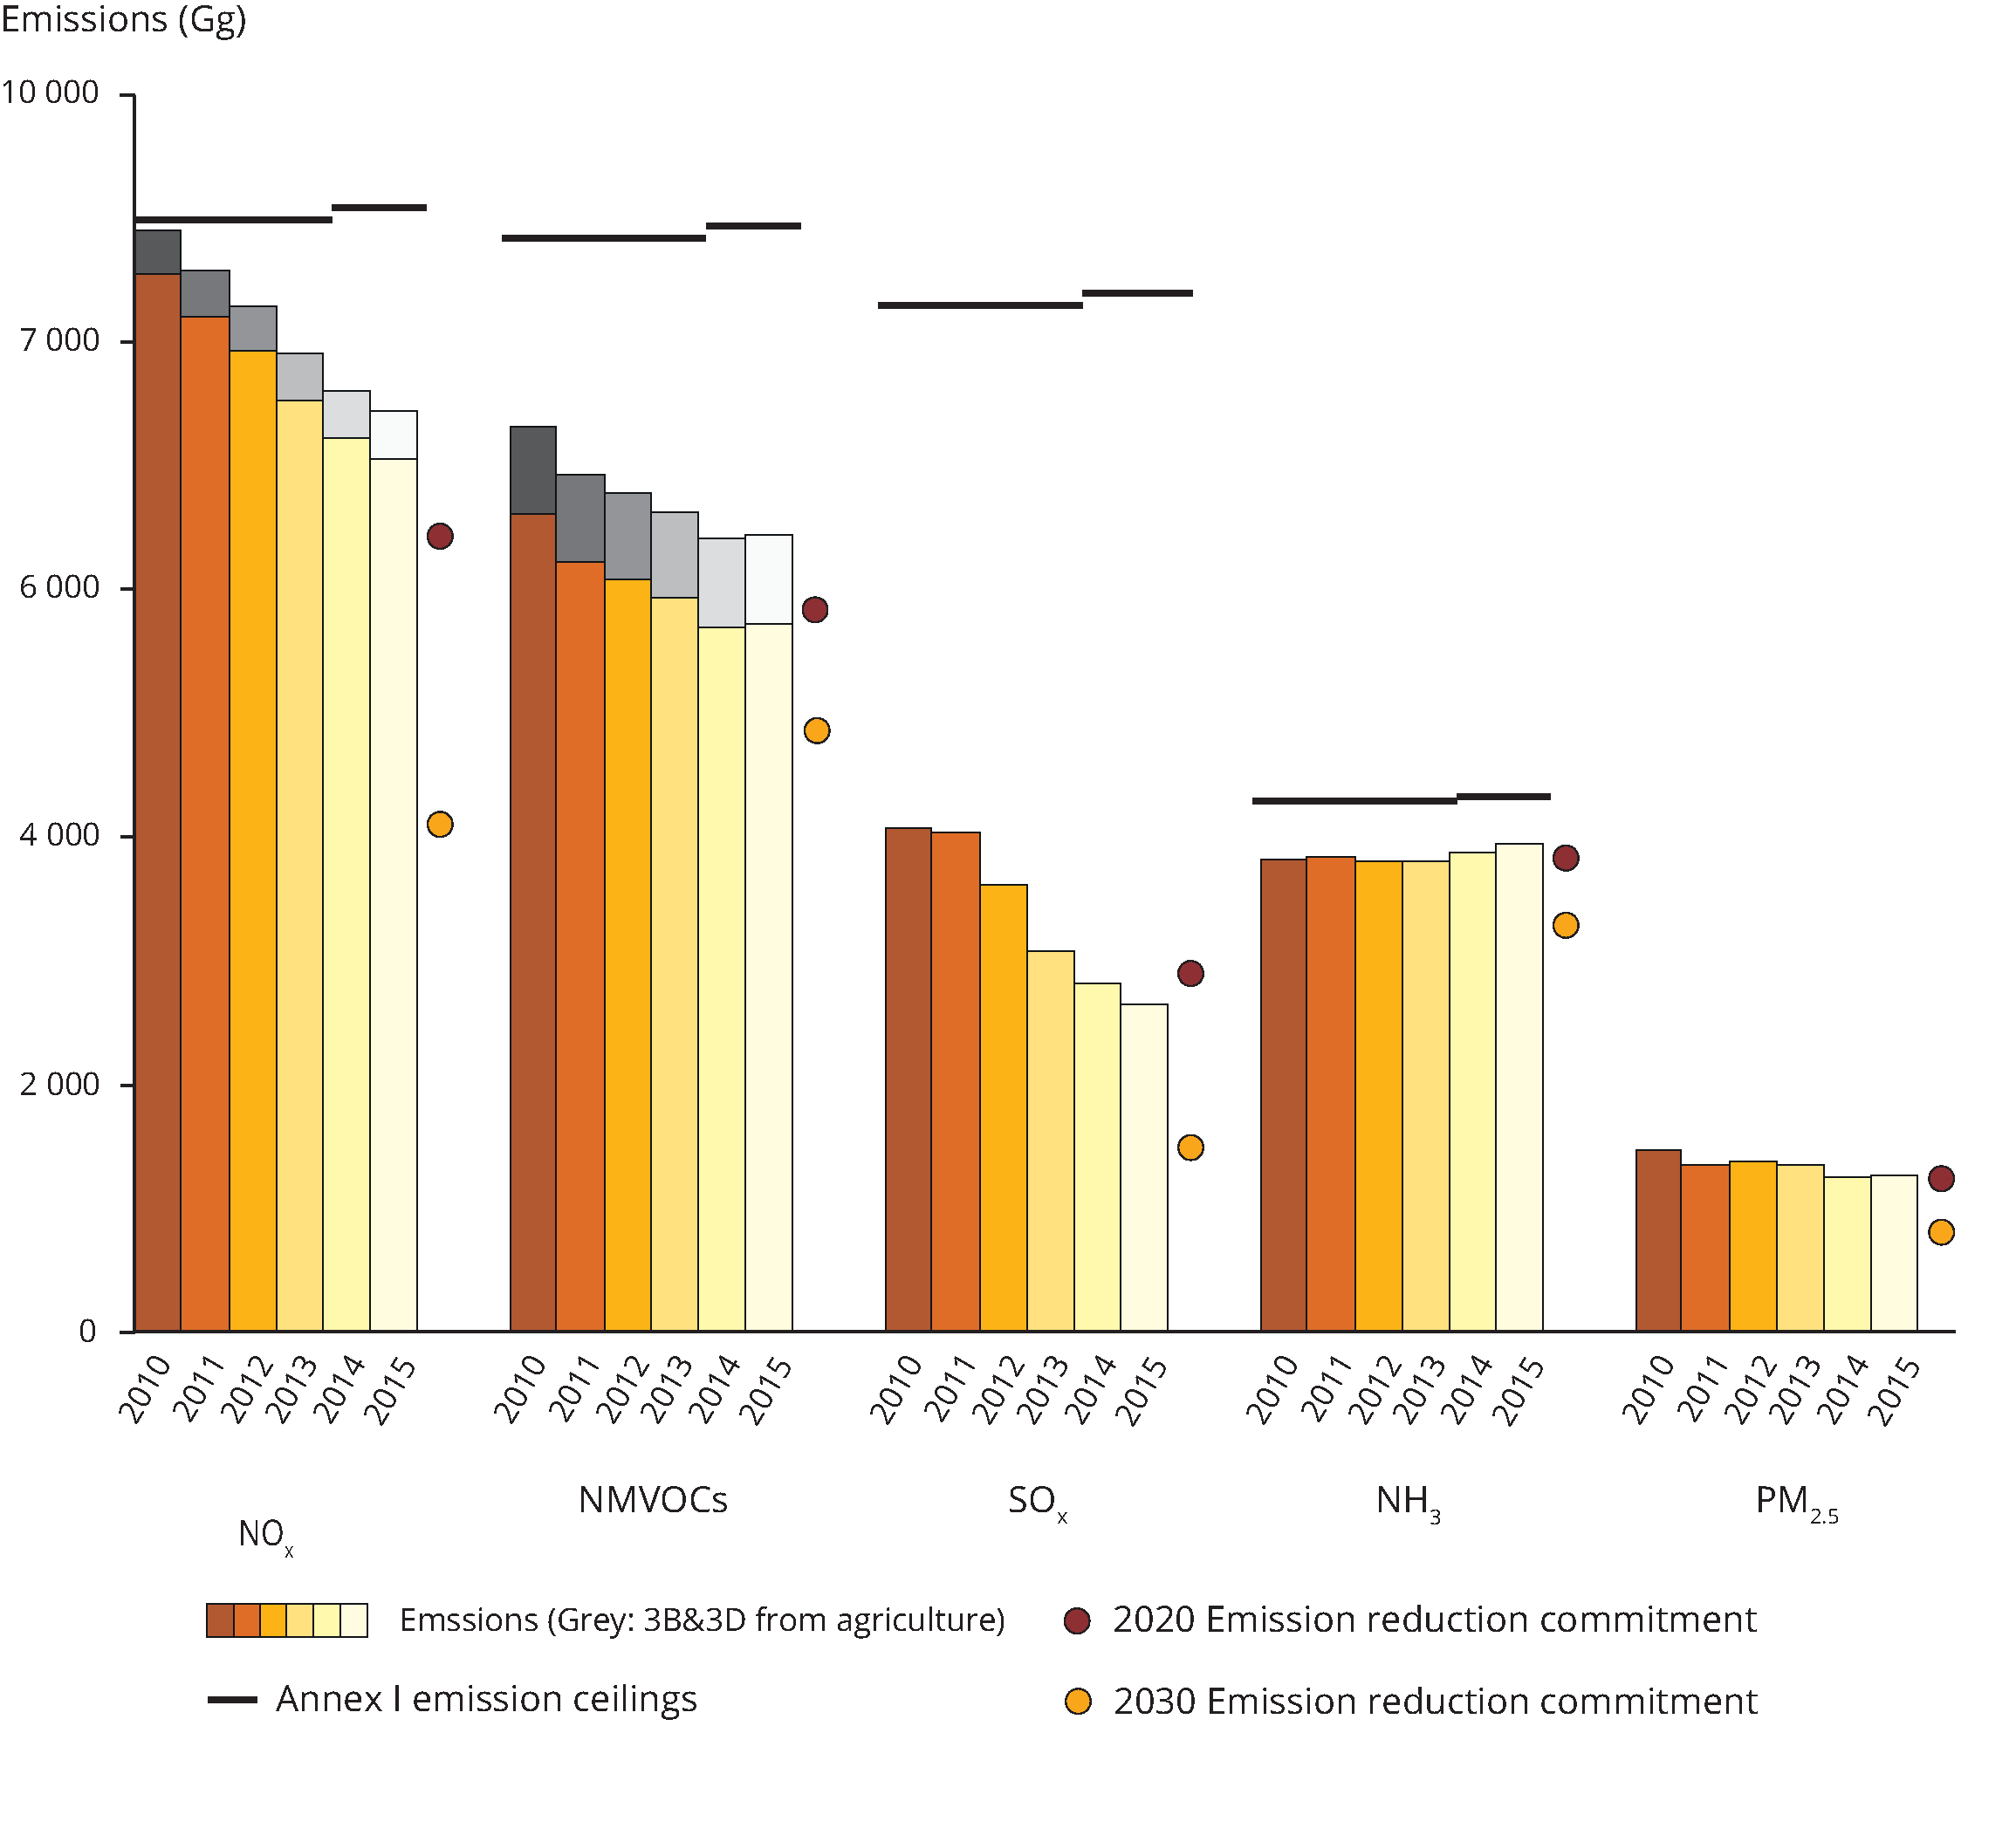
For assessing future attainment with the 2020 and 2030 reduction commitments, NOx and NMVOCs emissions from two main agricultural activities, manure management (3B) and agricultural soils (3D) are not considered. The magnitude of these emission sources is indicated by the top part of the NOx and NMVOC columns. Thus only the lower part of the NOx and NMVOCs columns should be considered for comparing with the 2020 and 2030 reduction commitments.


Document Actions
Share with others