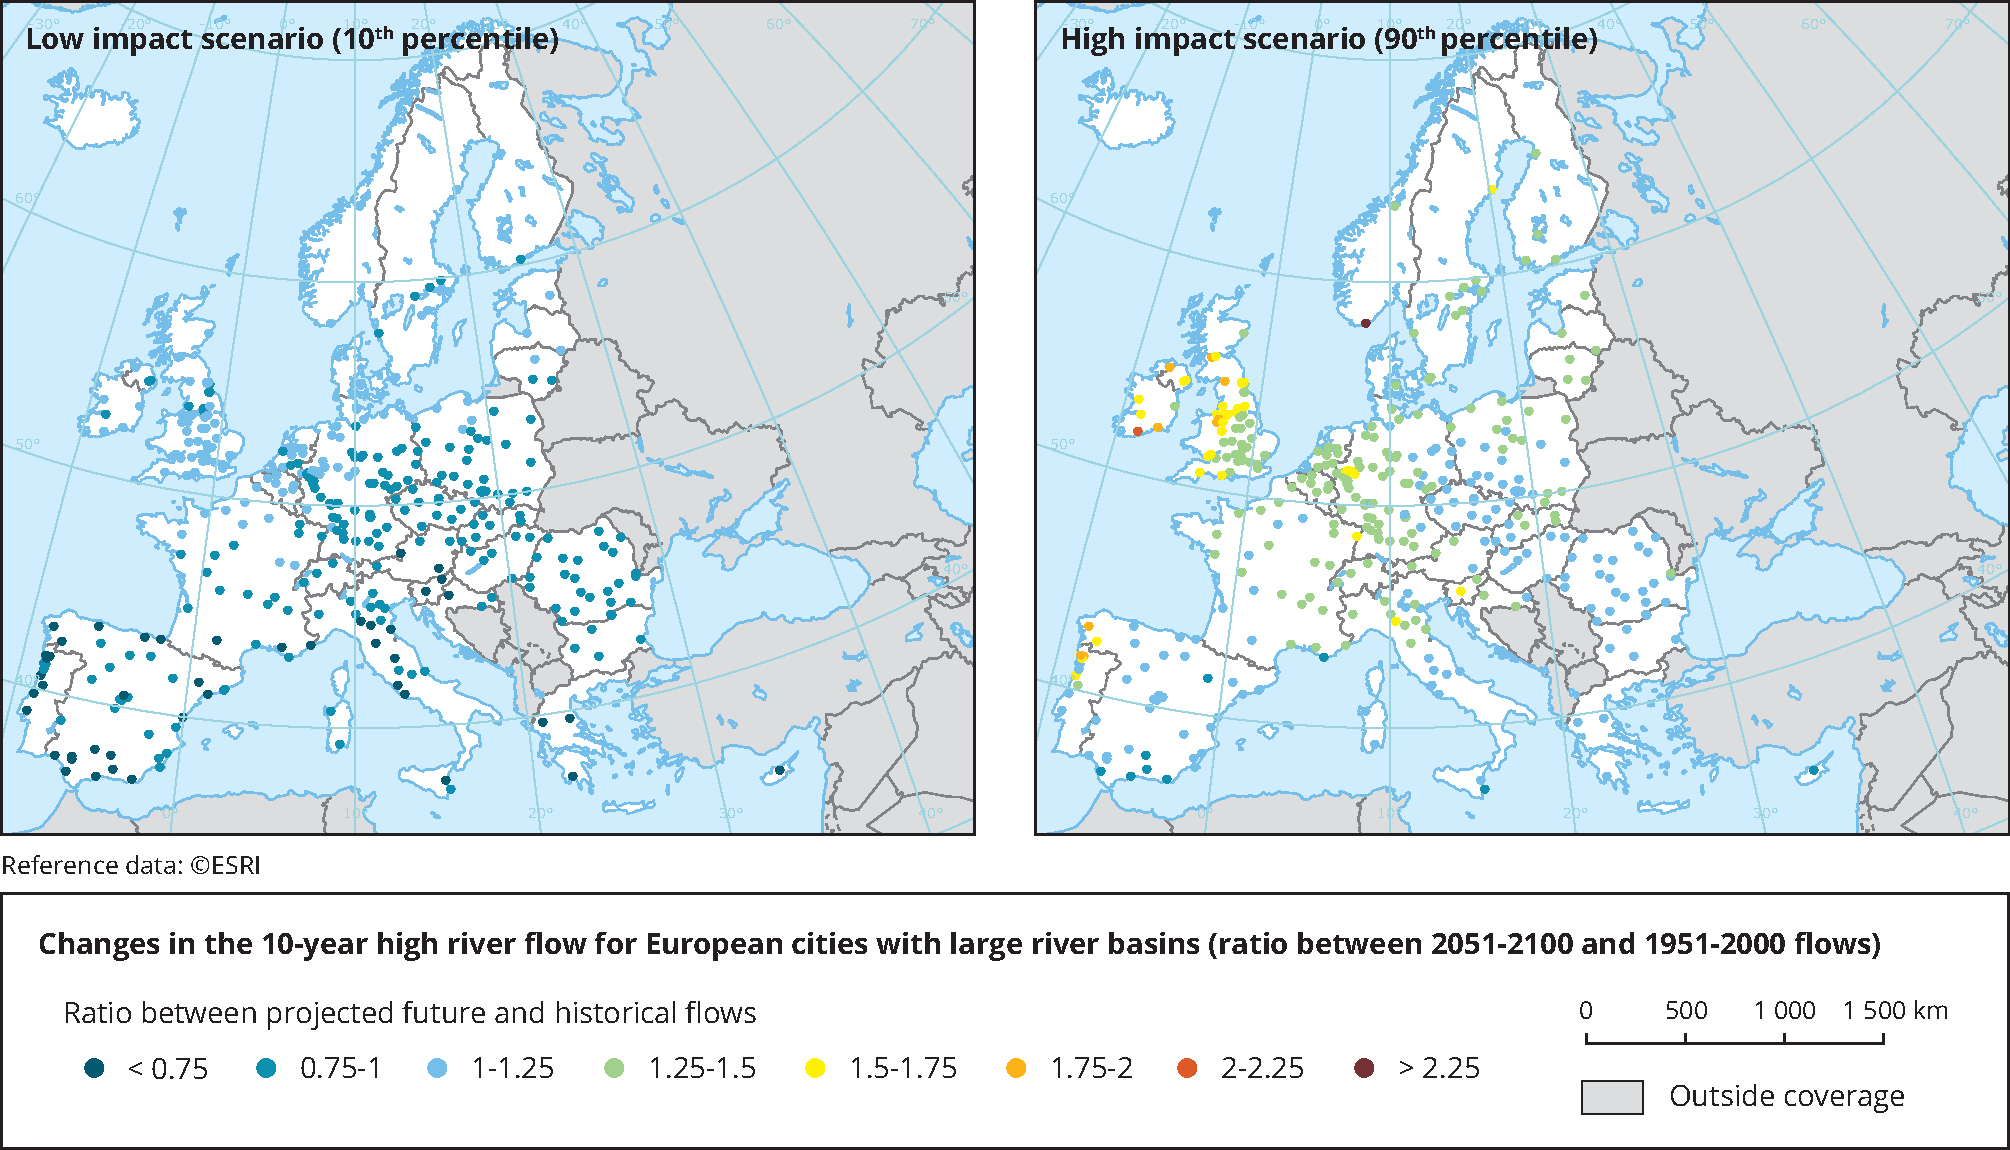
The 10-year high flow corresponds with the 1 in 10-year return periods of annual maximum daily discharge. The changes are calculated as the projected 2051–2100 10-year high flow divided by 1951–2000 10-year high flow. They are shown for low (10th percentile) impact scenario and high (90th percentile) impact scenario. Based on 50 climate model projections from the CMIP5 (Taylor et al., 2012), for the RCP8.5 emissions scenario. The DEM Hydro1K was used to delineate river basins for each city. The 1 in 10 year high flow was estimated using a regression model based on gauge discharge data from the Global Runoff Data Centre (GRDC), and the European daily gridded dataset, E-OBS (Haylock et al., 2008). The cities included in the analysis (365) are those that have an upstream river basin above 500 km2. The 50th percentile (median) scenario is available in the Urban Adaptation Map Viewer, see also Guerreiro et al. (2018).
Source: Adapted from Guerreiro et al. (2018).

 taken in account for the measurement values(s) of the data resource.")
Document Actions
Share with others