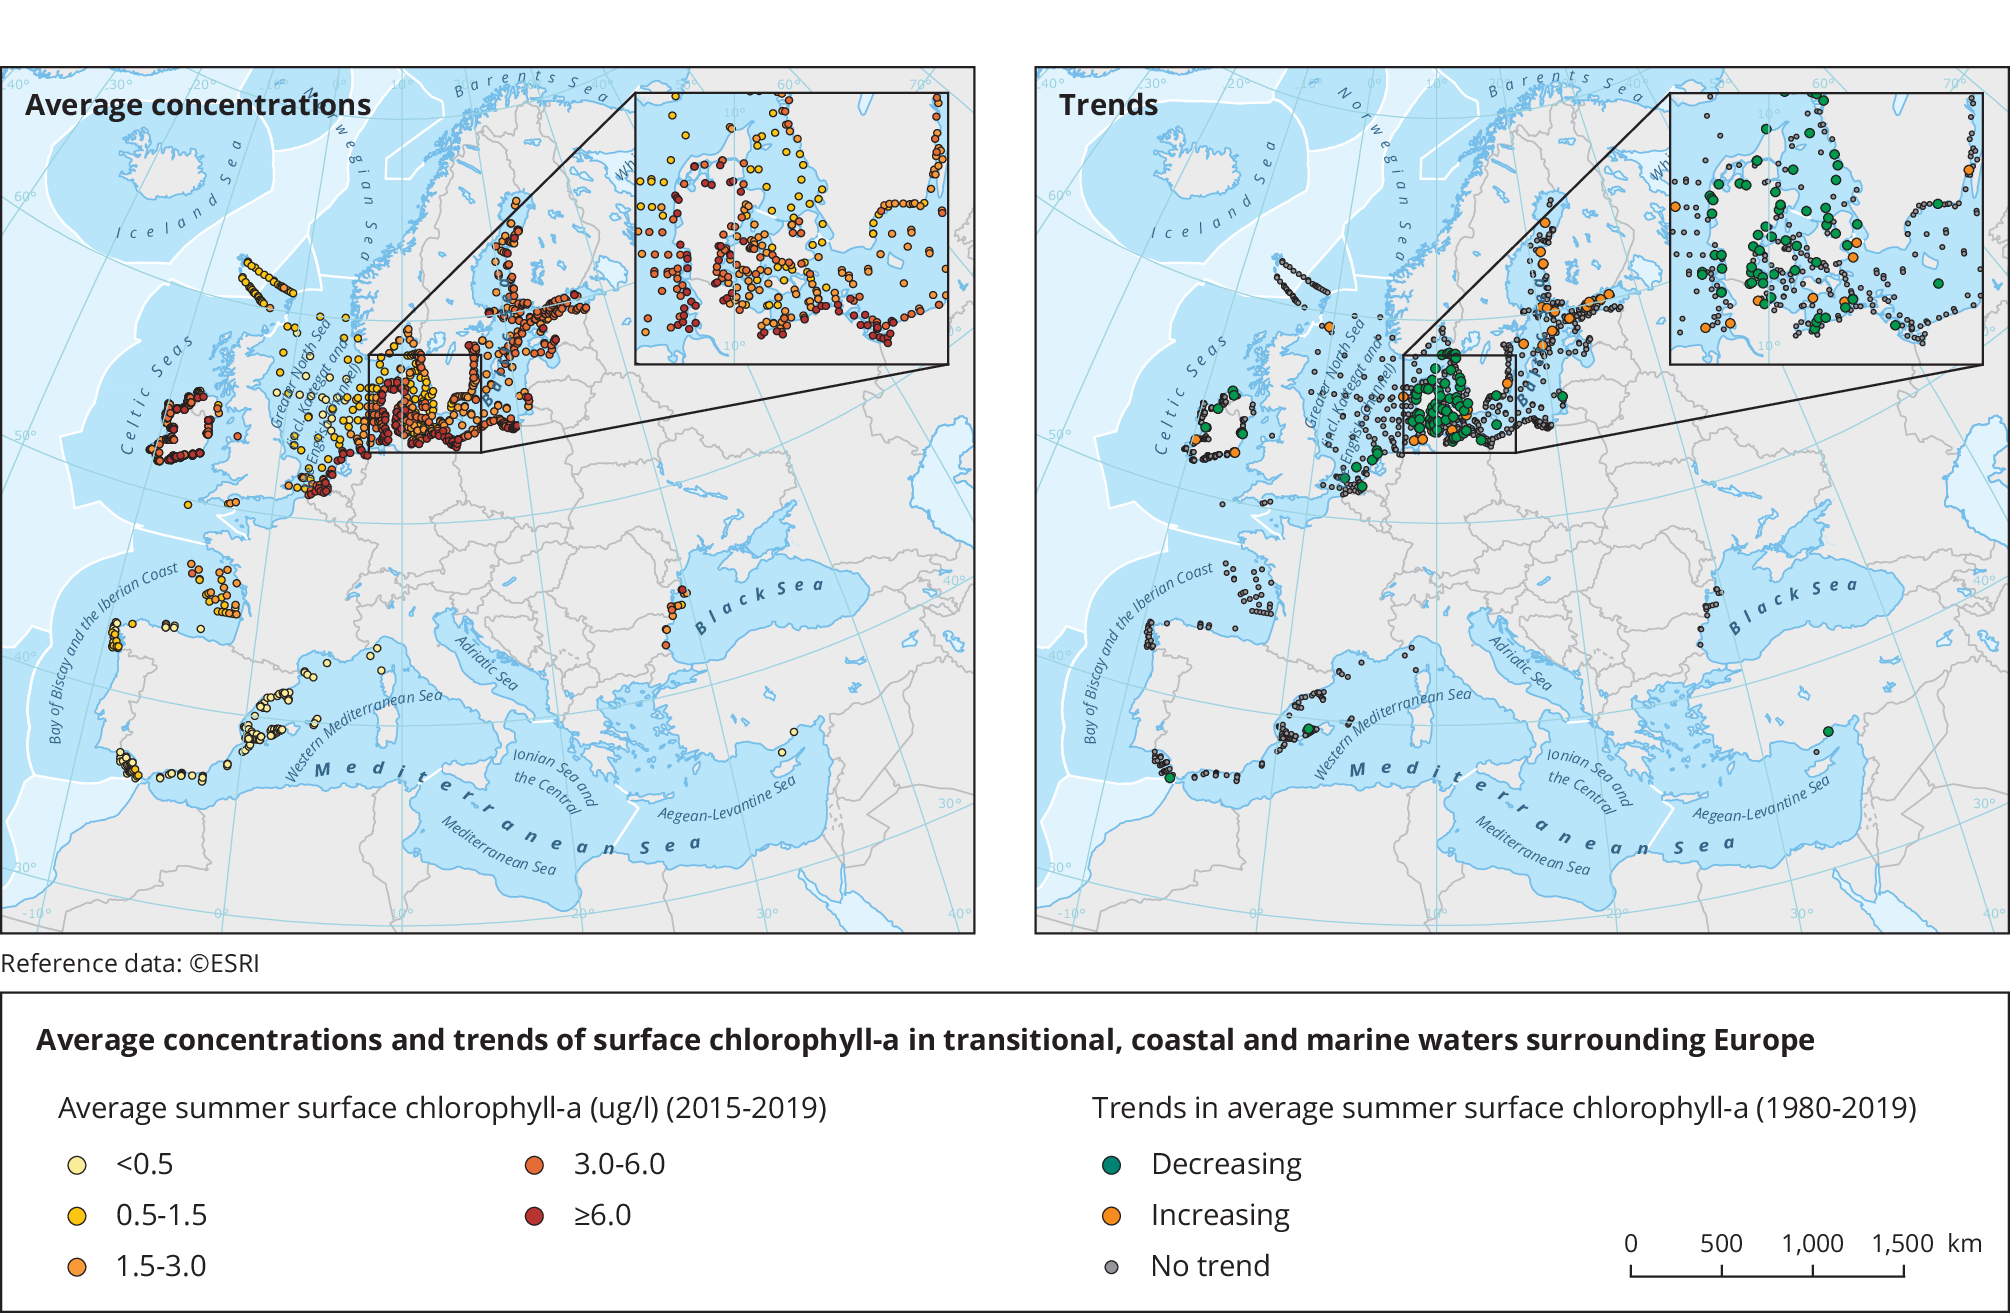
• Average chlorophyll-a concentrations were calculated using data from observations in summer (May to September) from the upper 10m of the water column, in locations with annual data for the last 5-year period (2015-2019), transformed to the logarithmic scale.
• Data were aggregated into squares of 0.01 degree × 0.01 degree for coastal stations (within 20km of the coastline) and 0.05 degree × 0.05 degree for open water stations.
• Temporal trends were estimated in locations with data for at least 5 years in the period 1980-2019 and updated in the last 5-year period (2015-2019), using the non-parametric Mann-Kendall test. A p-value of <0.05 was considered to indicate a statistically significant trend.
• Results reflect data availability, which may vary significantly across regions and over time.
Temporal coverage
1980-2019 (the temporal range specified is the maximum range of dates for raw observations but this range varies upon the availability of observations at each location).

 taken in account for the measurement values(s) of the data resource.")
Document Actions
Share with others