Data behind the map:
- Titles of the datasets
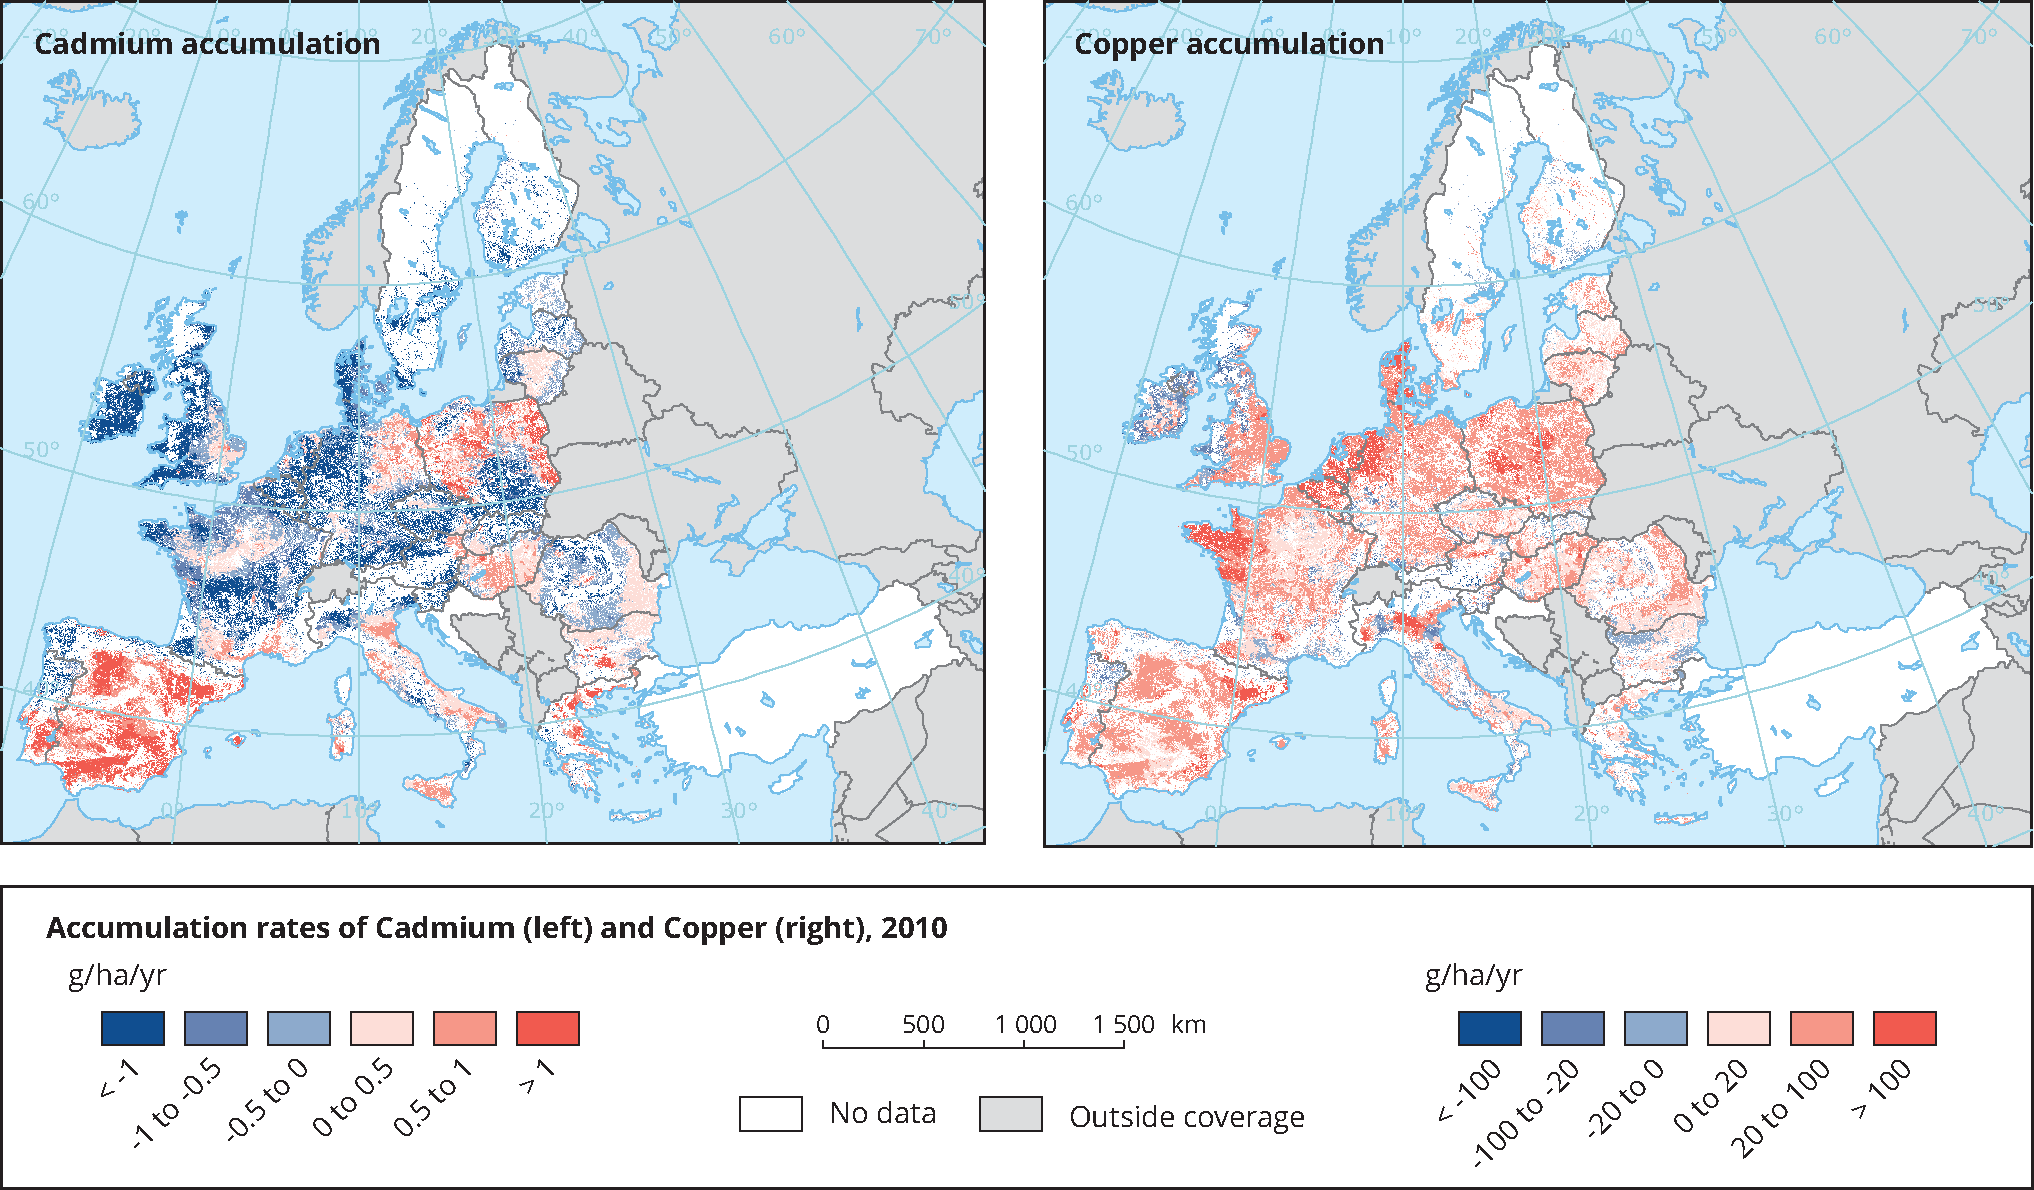
- Calculated cadmium (Cd) accumulation in EU27 for the year 2010 for approximately 40.000 NCUs.
- Calculated copper (Cu) accumulation in EU27 for the year 2010 for approximately 40.000 NCUs.
Footnote for both titles: Calculations are done with the model INTEGRATOR. NCUs (Nitrogen Calculation Units), being sub-divisions of NUTS3 regions, are unique combinations of soil type, administrative region, slope class and altitude class composed of clusters of 1 km x 1 km pixels.
- This is a ‘one-time-off’ dataset. In principle, the dataset could be updated when new data come available on e.g. soil metal concentrations but this is not yet foreseen. An update has been made in the past however, between 2014 and 2019 (see below)
- Link to the dataset is not possible. The maps were first published in
De Vries, W., P. Römkens, J. Kros, J. C. Voogd, C. Schröder and E. Aksoy, 2014. Field-scale balances of nitrogen, phosphorus, copper, zinc, cadmium and lead, and the impacts of policies on those balances. European Environment Agency technical report, ETC-SIA. Available under EIONET webpage: http://forum.eionet.europa.eu/etc-sia-consortium/library/2014-subvention/182_2-impact-policy-changes/deliverables
Note, however, that since then updates were made in the calculation of the metal leaching and thus in metal accumulation.


Document Actions
Share with others