|
Indicator
|
EU indicator past trend
|
Selected objective to be met by 2020
|
Indicative outlook
of the EU meeting
the selected
objective by 2020
|
|
Resource productivity
|

|
Improve economic performance while reducing pressure on natural resources — Roadmap to a resource efficient Europe
|

|
|
There was a decline in the use of materials and a rapid rate of increase in resource productivity following the economic downturn of 2007/2008. The rate of increase in resource productivity has been projected to return to the more gradual rate seen prior to the economic downturn of just below 1 % per year
|
For further information on the scoreboard methodology please see Box I.1 in the EEA Environmental indicator report 2016
Setting the Scene
The 7th EAP priority objective 2 (EU, 2013) includes the objective that by 2020 the resource efficiency of the EU has to improve. Resource efficiency can lower environmental burdens by reducing the overall consumption of materials and other resources. It can also help to sustain economic development by securing the appropriate supply of resources and investments in innovation, while increasing global competitiveness (OECD, 2015). This briefing presents trends in resource productivity. Since resource productivity measures the quantity of economic output produced using a certain amount of extracted resources, it is used as a proxy for resource efficiency by the European Commission. It effectively measures the decoupling of material use from economic growth. However, under conditions of relative decoupling, overall material use can increase despite an increase in resource productivity.
Policy targets and progress
The ‘Resource-efficient Europe’ flagship initiative (EC, 2011a) of the Europe 2020 Strategy is aimed at promoting the decoupling of economic growth from resource use. Absolute decoupling means that resource use declines or remains stable under conditions of economic growth.
The broad objectives of the ‘Resource-efficient Europe’ flagship initiative are implemented by the Roadmap to a Resource Efficient Europe (EC, 2011b) whose goal is to ensure increasing economic performance while reducing pressure on natural resources. Resource efficiency is viewed as the means to achieve this objective and resource productivity is the lead indicator for monitoring the progress of the actions in the roadmap. Neither the roadmap nor any other EU policy or strategy sets quantitative targets for improvements in resource productivity, although some Member States have adopted national targets (see country-level information section).
The Roadmap to a Resource Efficient Europe committed the European Commission to discussing and agreeing on resource efficiency indicators and targets. The 7th EAP recognised that ‘Resource efficiency indicators and targets … would provide the necessary guidance for public and private decision-makers in transforming the economy. Once agreed at Union level, such indicators and targets will become an integral part of the 7th EAP.’ While targets have not been defined to date, a set of indicators has been published since 2015 in the form of the Resource Efficiency Scoreboard (EC, 2015a).
Although there were some fluctuations, 2000 to 2007 was a period during which material use (domestic material consumption, DMC) saw relative decoupling from economic growth (gross domestic product, GDP). In other words, material use grew but at a slower rate than the economy. Resource productivity for the EU as a whole increased by nearly 7 % over this period. The period from 2007 onwards is characterised by absolute decoupling, as material use has declined sharply.
Between 2008 and 2009, both material use and GDP decreased, although material use fell more rapidly than GDP. Since 2009, despite some return to economic growth, material use has continued to fall. The overall result of the trends in these two variables is that resource productivity increased by 35 % between 2000 and 2015, with most of the improvement occurring after 2008.
Europe appears to be extracting more value from the material resources it uses. While this is indeed a positive development, a closer look reveals that it would not be justified to attribute this entirely to the success of environmental policies. Other economic and technical factors seem to have played a role, including the changing structure of countries’ economies, the effect of the economic downturn, globalisation and increasing reliance on imports, and even the nature of the indicator itself (EEA, 2016).
There have been some improvements in the resource productivity of individual sectors. Since 2008, this has been dominated by the fact that the economic downturn affected the material-intensive industries of manufacturing and construction more than it affected services, which typically are less material intensive (Eurostat, 2015a).
The 19 % drop in total material use between 2007 and 2015 was largely due to a 29 % decline in the demand for non-metallic minerals (Figure 2). This was caused by a slump in the construction sector where gross value added (in chain-linked volumes, reference year 2010) fell by almost 17 % over the same period (Eurostat, 2016a).
A slowdown in construction activity can have significant implications for the resource productivity of the economy as a whole. In 2007, the construction sector was responsible for more than one third of total material use in the EU (Eurostat, 2016b) but contributed only 6.4 % of its total economic output (Eurostat, 2016a). Therefore, this sector had a low resource productivity compared with the economy as a whole. Any shrinkage in this sector, as occurred between 2007 and 2013, will therefore lead to an increase in the resource productivity of the whole economy. The same is true for the manufacturing industries.
There have also been some improvements in the resource productivity of some other sectors. A notable example is the decline in the consumption of fossil fuels since 2004. This decline accelerated immediately after the economic downturn and is also the result of an increasing shift from fossil fuels to renewable energy and of overall improvements in energy efficiency in the economy as a whole (EEA, 2016). These latter developments can be expected to continue to 2020 and beyond in response to EU and national climate and energy policies.
A further cause of the underlying increase in resource productivity may be the long-term shift of the EU towards a service economy. Services increased their contribution to the EU economy from 71.5 % in 2003 to 73.5 % in 2013 (Eurostat, 2015b).
Detailed projections of material use within the four main material groups from 2012 to 2030 have been carried out for the European Commission. A wide range of factors was modelled, including technological developments, policy in energy and climate, agriculture, transport and the manufacturing sector, and demographic and economic trends. The modelling analysis projects a 0.7 % rise in material use per year but a higher rate of growth in GDP, resulting in a 0.9 % increase in resource productivity per year (Cambridge Econometrics, 2014). This is similar to the rate observed between 2000 and 2008. The projections would suggest that the 7th EAP 2020 objective of increasing resource efficiency should be met.
Country-level information
Resource productivity varies between countries by a factor of nearly 20. This variation is not a sign of more efficient industry in one country compared with another, but rather a reflection of the types of material resources available in the country and its economic structures. Countries with service-based economies will tend to have higher resource productivity than economies with a high proportion of heavy industry, since service industries typically have a lower demand for material inputs (EEA, 2013).
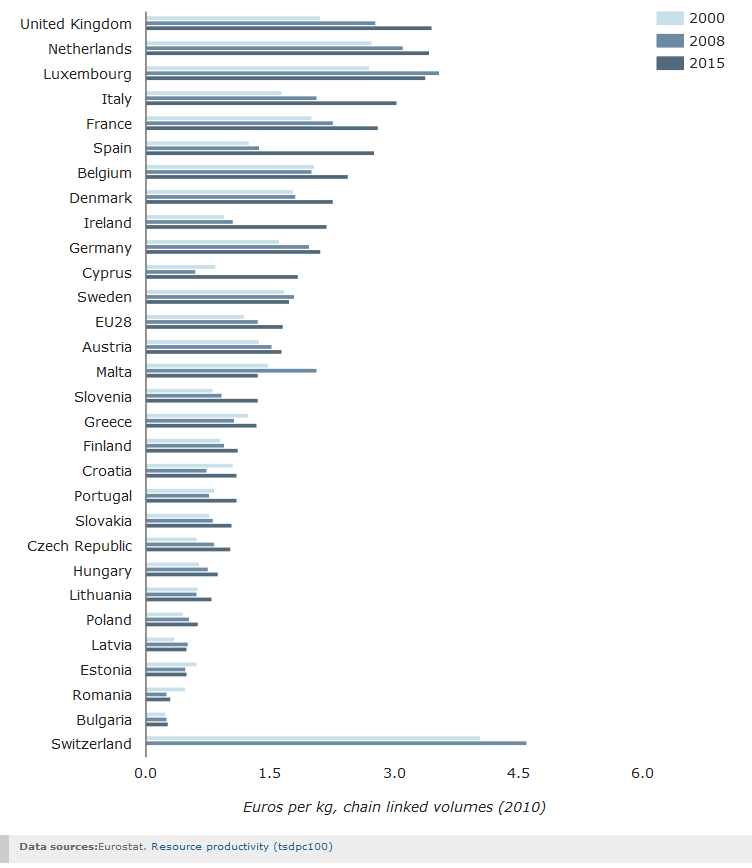
Note: 2013 is the latest year for Norway and Serbia. Resource productivity is measured in Euros (chain-linked volumes, reference year 2010) per kilogram of domestic material consumption (euroCLV2010/kg DMC).
Countries with the highest resource productivity in the EU are the United Kingdom, the Netherlands and Luxembourg, with values around EUR 3.5/kg. Resource productivity improved in all but three Member States between 2000 and 2015. The exceptions were Estonia, Malta and Romania. For many countries, gains in resource productivity have been most prominent since 2008. These have again largely been caused by a drop in the demand for non-metallic minerals, as a result of a post-downturn slump in the construction sector, and to longer term reductions in the consumption of fossil fuel carriers. The countries that experienced the sharpest decline in material use for non-metallic minerals between 2007 and 2015 were Croatia, Cyprus, Greece, Ireland, Italy, Portugal, Slovenia and Spain, ranging from a 75 % reduction in the case of Spain to a 42 % reduction in the case of Portugal.
It is hard to determine whether policy has had an effect or not. Only three countries (Austria, Finland and Germany) and two sub-national regions (Flanders and Scotland) have adopted dedicated strategies for resource efficiency. A number of other countries incorporate resource productivity concepts into other strategies and policies, including those on waste, energy and industrial development, or national reform programmes (EEA, 2016). National efforts to improve resource productivity are based on a mixture of economic and environmental considerations. The most prominent factors are the need to increase competitiveness and to secure access to raw materials and energy (or reduce reliance on imports), while lowering pressures on the environment. In addition, a number of European countries have already developed, or are planning to develop, national raw material strategies (EEA, 2016).
Moreover, nine EU Member States (Austria, Estonia, France, Germany, Hungary, Latvia, Poland, Portugal and Slovenia) have adopted resource productivity targets (as of December 2015). These vary somewhat in their scope, format and timeframes, but all aim to achieve improvements in resource productivity. It is difficult to compare the ambitions of these targets between countries because of the varying time periods over which they have to be achieved and the different starting levels in terms of resource productivity (Figure 3). With the exception of Germany, all countries’ targets were adopted after the economic downturn and most since 2012. The effects of Member State targets and policies may become evident only during the second half of the decade.
Improving resource productivity has not necessarily led to reduced overall material use. Of the 25 EU Member States whose resource productivity improved between 2000 and 2015, eight (Bulgaria, Croatia, Latvia, Lithuania, Luxembourg, Poland, Slovakia and Sweden) have, nevertheless, experienced an increase in demand for materials of between 19 % and 46 % over the same period. The three countries (Estonia, Malta and Romania) that did not achieve improvements in resource productivity saw even higher increases in material use. Romania, Estonia and Malta’s material use rose by 168 %, 104 % and 60 %, respectively (Eurostat, 2016b). In general, policies and targets for reducing overall material use are far less common than those aimed at increasing resource productivity.
Outlook beyond 2020
The long-term vision of the 7th EAP includes the goal that Europe’s growth should be decoupled from resource use. This means not only improvements in resource productivity, but also absolute reductions in material use.
The EU has been forecast, under certain conditions, to increase its resource productivity by 14 % between 2014 and 2030 (Cambridge Econometrics, 2014). Through specific policies to promote the transition to a more circular economy, as called for by the European Resource Efficiency Platform, this rate could possibly double. While contributing significantly to the sustainability dimension of growth, increasing resource productivity by 30 % would also have a positive impact on job creation and GDP growth (EC, 2014b).
Industry already recognises the strong business case for improving resource productivity. It is estimated that resource efficiency improvements along the whole value chain could reduce the need for material inputs by 17 – 24 % by 2030 (Cambridge Econometrics, 2014). Better use of resources could represent an overall savings potential of EUR 630 billion per year for the European manufacturing industry (INNOVA, 2012).
Of the nine countries that have adopted resource productivity targets, five include targets beyond 2020: Austria, France, Latvia, Portugal and Slovenia. Austria aims to achieve a four- to ten-fold increase in resource productivity over 2008 levels by 2050. Such ambitious targets and a more resource-efficient EU will require further fundamental changes in production and consumption patterns. The adoption of the Circular Economy Package (EC, 2015a) and recent efforts by some countries to analyse their material resource availability and needs, and to develop raw material strategies, demonstrate that Member States are changing their approach towards the use of materials.
Resource productivity is measured here as the economic output (GDP) in euros (chain-linked volumes, reference year 2010) per unit weight (kilograms) of material use (DMC). DMC comprises the consumption of fossil energy carriers, biomass, metal ores and non-metallic minerals, such as sand and gravel, used in construction. DMC is measured as the used weight of domestically extracted material, plus the direct weight of imports, minus the direct weight of exports.
A potential weakness of using DMC in a resource productivity indicator is that DMC excludes the raw materials extracted in non-EU countries and embedded in imported goods. An alternative to DMC as a resource productivity indicator is raw material consumption (RMC). RMC presents the import and export flows expressed in their raw material equivalents. These are currently estimated with models and are still under development. RMC has been developed by Eurostat for the EU-27 but is not yet available for individual Member States. In contrast, DMC is available for all Member States, has a long time series and is disaggregated into material components.
Both DMC and RMC have their weaknesses as proxies for environmental pressures caused by material use. All material types are given equal significance when compiling DMC. This is despite large differences in scarcity and the impacts caused per kilogram by the extraction of different types of material and use, e.g. gravel versus mercury. Moreover, DMC and RMC have exhibited similar trends since at least 2002, and therefore the choice of one or the other will have had little effect on trends to date in resource productivity (EEA, 2015; Figure 2).

Document Actions
Share with others