8.1 Greenhouse gas emissions
Iceland, Liechtenstein, Norway, Switzerland and Turkey are all Annex I countries to the United Nations Framework Convention on Climate Change (UNFCCC). Iceland, Liechtenstein and Norway have also closer association with the EU for a number of commitments on greenhouse gas (GHG) emission reductions. In particular:
- Iceland, Liechtenstein and Norway have been participating in the EU Emissions Trading System (ETS) since 2008.
- Iceland decided to jointly fulfil commitments with of the EU and its Member States in the second commitment period of the Kyoto Protocol to the UNFCCC, i.e. to reduce its GHG emissions by 20 % by the year 2020, compared to 1990 levels. As an Intended Nationally Determined Contribution (INDC) for the post-2020 agreement under the UNFCCC, Iceland has submitted its commitment to reduce GHG emissions by 40 % by 2030 compared to 1990 levels. It intends to fulfil this commitment jointly with the EU; the details of collective delivery are yet to be determined (Iceland, 2015).
- Norway and Iceland have expressed an intention to participate in the joint action taking place in the EU to reduce emissions from sectors not covered by the EU ETS (i.e. in the Effort Sharing legislation for the period from 2021 to 2030). For the period from 2021 to 2030 Norway has made clear that it intends to fully participate in the reduction effort for the non-ETS sectors. As Member State targets range from 0% to -40%, on the basis of Gross Domestic Product (GDP) per capita, Norway would be attributed an estimated numerical reduction target of 40% below 2005 levels and flexibility mechanisms will be available for Norway and Iceland as for Member States. Final targets for Iceland and Norway will be determined only when the Commission’s legislative proposal on a new effort sharing is adopted (EC, 2016b).
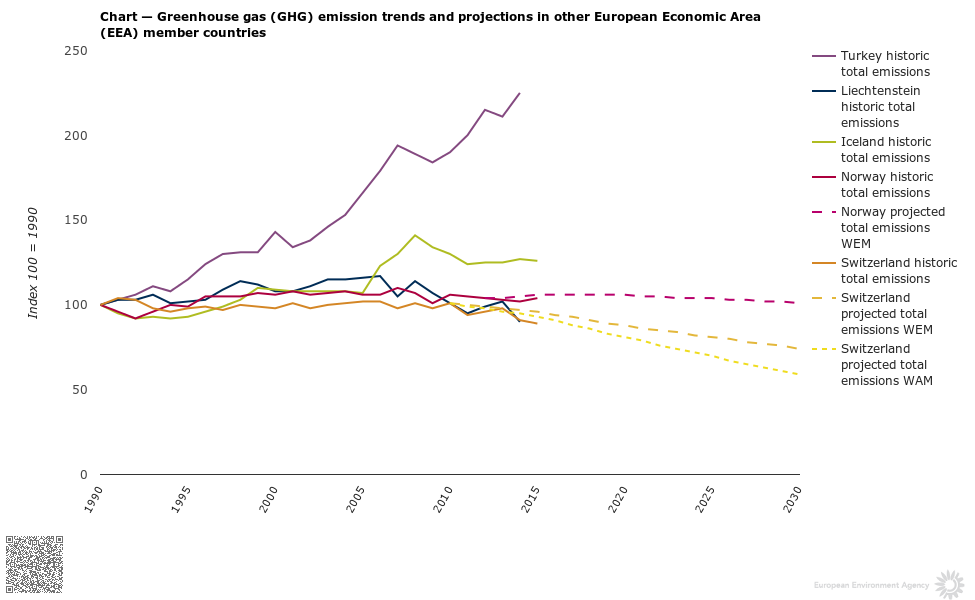
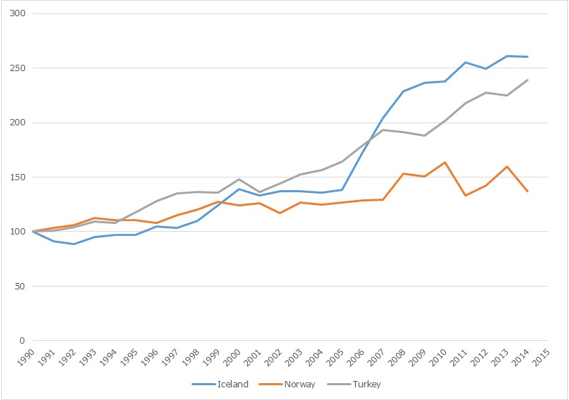
Historic GHG emissions in Iceland, Liechtenstein, Norway, Switzerland and Turkey followed very different trends between 1990 and 2014. Updated information on emission projections was only available for Norway and Switzerland (see Figure 3.1).
Iceland also set a long-term GHG mitigation target of between 50 % and 75 % by the year 2050 compared to GHG emissions in 1990. In 2014, Iceland’s emissions had increased by 27 % compared to 1990 levels. Therefore Iceland does not currently seem to be on track to reach its target for 2020.
Liechtenstein also aims to emit at least 40 % less GHG emissions in 2030 compared to 1990 (Liechtenstein, 2015). To attain this target, Liechtenstein has also set itself a sectoral goal: GHG emissions from the energy sector will decrease by 20 % between 1990 and 2020. In 2014, Liechtenstein’s emissions were 10 % lower than in 1990. Additional efforts are therefore necessary if Liechtenstein is to reach its 2020 target. For 2030, Liechtenstein has committed to reduce its GHG emissions by 40 % compared to 1990 under the UNFCCC [1].
Norway’s target is to reduce its GHG emissions by 30 % in 2020 compared to 1990. According to its INDC (Norway, 2015), Norway aims to reduce its GHG emissions by at least 40 % in 2030, compared to 1990 [2]. Norway also aims to reduce emissions by the equivalent of 100 % of its own emissions by 2030, thus becoming climate neutral, achieved through emissions trading in the EU, international cooperation on emission reductions, other forms of emissions trading and project based cooperation. In 2014, GHG emissions had increased by 2% compared with 1990.
Switzerland’s target is to reduce its GHG emissions by 20 % in 2020 compared to 1990. Like Norway, it also sets a more ambitious GHG reduction target of 30 % reduction in 2020 compared to 1990, provided that the international community agrees on a stricter climate policy. For 2030, Switzerland submitted an INDC to the UNFCCC which states its intention to reduce its GHG emissions by 50 % compared to 1990 levels (10). This target will partly be reached through the use of carbon credits from international mechanisms (Switzerland, 2015). In 2014, emissions in Switzerland were reduced by 9% compared to 1990 levels.
Turkey has submitted an INDC to the UNFCCC with a 21 % economy-wide cut in GHG emissions by 2030, compared to a business-as-usual scenario (Turkey, 2015). This implies an increase in GHG emissions limited to a level of 929 Mt CO2-eq. in 2030, which is nearly 5 times the emissions of 1990. To reach its national target, Turkey aims to use carbon credits from international market mechanisms. In 2013, Turkey’s GHG emissions had increased by 125 % compared to 1990.
Click on the image for interactive data visualisation
Note: Projections display total GHG emissions excluding LULUCF and international aviation. Solid lines represent historic values, while dashed lines represent WEM projections.
Values shown for Iceland include inventory data, taking into account total CO2 emissions from industrial processes. Iceland may exclude these emissions for compliance in the first commitment period of the Kyoto Protocol.
Norway’s INDC includes emissions and removals from LULUCF, which are not shown in this figure.
Source: Iceland, 2016; Liechtenstein, 2016; Norway, 2016; Switzerland, 2016; Turkey, 2016.
8.2 Renewable energy
The Renewable Energy Directive (RED) is a text with ‘EEA relevance’, i.e. it is relevant to member countries of the European Economic Area (not to be confused with the European Environment Agency). In accordance with the RED, Iceland and Norway submitted national renewable energy action plans (NREAPs) to the European Commission with 2020 targets and details of development steps.
Iceland’s 2020 target on renewable energy sources (RESs) under the RED was set to 72 % of gross final energy consumption [3], while the national target under the NREAP was set to 76.8 % by 2020 (see Table 8.1). Although these targets are higher than for most Member States, they are also lower than current levels. In 2014, the proportion of RES use already exceeded its 2020 target by 5 percentage points. This is because of the exceptional potential for hydro and geothermal energy in this country. These energy sources are mainly used for district heating and the production of electricity. A total of 80 % of the primary energy supply is from renewable resources, and the remaining 20 % comes from imported fossil fuels, which are mainly used in transportation and fisheries.
Norway’s indicative RED trajectory target for 2020 is that renewable energy should account for 68 % of gross final energy consumption. Norway is ahead of its indicative RED target for 2013/2014 and its anticipated NREAP trajectory for 2014. In 2014, renewable energy accounted for 69 % of gross final energy consumption in Norway and, therefore, in this year, Norway had already exceeded its 2020 RES target by one percentage point.
No information is available from EU sources on the proportions of RES use and targets for Liechtenstein, Switzerland or Turkey.
| Country | 2014 share of RES (%) | 2020 target under the RED (%) | 2020 target under NREAP (%) | Distance to 2020 target in 2014
(percentage points) |
|---|
| Iceland |
77.1% |
72.0% |
76.8% |
5.1% |
| Norway |
69.2% |
67.5% |
67.5% |
1.2% |
Source: EU, 2009; Norway, 2013, Iceland, 2014; EFTA, 2016; Eurostat, 2016c.
8.3 Energy efficiency
Statistics on energy consumption are available from the European Commission for Iceland, Norway and Turkey. Between 1990 and 2014, primary energy consumption increased in these three countries, although to greatly varying extents (from 7 % in Norway to 51 % in Iceland); over the same period, primary energy consumption in the EU increased by 12 % (Eurostat, 2016a and 2016b). Although Norway and Turkey experienced a relatively steady increase over the whole period, Iceland experienced a pronounced jump in primary energy consumption after 2005. Between 2005 and 2014, the primary energy consumption of Iceland, Norway and Turkey increased by 88 %, 8 % and 46 %, respectively.
In Switzerland, final energy consumption decreased by 10 % between 2005 and 2014 (IEA, 2016).
Source: Eurostat, 2016a and 2016b.

Document Actions
Share with others