Which cities are included in the viewer?
The viewer presents cities as defined by the European Commission’s Urban Audit, in its 2020 edition. This geospatial dataset includes cities with a population over 50,000 inhabitants. A similar dataset is available for download from the Eurostat website (note that the European City Air Quality Viewer uses a processed 2020 version of that dataset with the most recent population numbers from Eurostat).
What data do we use?
We use data on concentration of fine particulate matter, or PM2.5, reported to the EEA by our member countries under the European Union Ambient Air Quality Directives. Two types of data are used.
- For the last full calendar year, ‘Up-to-date’ air quality data is used to calculate the annual average. This data is reported to the EEA on an hourly basis by member countries (known as E2a).
- For the calendar year before last, data used has been officially validated by the countries prior to being reported to the EEA (known as dataflow E1a).
Why do we focus on particulate matter?
Fine particulate matter is the air pollutant with the highest impact on health in terms of premature death and disease. Long term exposure to air pollution is associated with the most serious health outcomes, including cardiovascular and respiratory diseases.
What air quality monitoring stations does the data come from?
To produce this tool, we use data from urban background and suburban background air quality monitoring stations that are situated within the boundaries of the cities, as defined by the Urban Audit, and for which countries report data to the EEA. These stations provide a robust picture of the exposure of the population to air pollution in cities.
Air quality is also measured at industrial stations and traffic stations. Data from these stations are not used for this tool, as they are used to measure levels in more polluted areas, such as around industrial sites and near motorways and major roads with dense traffic. As such, they measure the exposure of populations around major industrial areas and roads and do not measure the exposure of the general population. In addition, industrial and traffic stations are unevenly distributed in cities across Europe, which might introduce bias when making comparisons. Nevertheless, concentrations at traffic stations are shown when clicking on the cities, as explained above.
Air quality is also monitored in rural areas, with the aim, for instance, of understanding impacts on crops and natural ecosystem. Rural stations tend to be located away from the cities and are not included in this tool.
How do calculate the average concentrations of fine particulate matter over the past two years?
- We calculate the annual mean concentration of fine particulate matter for a city by averaging the daily means for all its urban background stations and suburban background stations over the past calendar year. For this we use the ‘up-to-date’ air quality data (E2a). Unrealistic concentrations above 1000 ug/m3 are removed from the E2a time series prior to the calculation of the average.
- We calculate the annual mean concentration of fine particulate matter for a city by averaging the daily means for all its urban background stations and suburban background stations over the year before last. For this we used the validated air quality data (E1a).
- We use the results of step 1 and 2 to calculate the mean concentration across those two calendar years.
For some cities, we do not have data for either step 1 or step 2. In such cases, we use the annual mean for the available year.
What are the requirements for data coverage?
For data from a station to be included, a minimum of 75% temporal data coverage is required. This means that for an individual station, we consider those with more than 274 valid daily values per calendar year (or 275 days in a leap year).
Which are the missing cities?
- Cities that are not included in the database of cities established under the European Commission’s Urban Audit.
- Cities that do not have any air quality monitoring stations for PM2.5 regardless of their type.
- Cities that do not have urban and/or suburban background PM2.5 monitoring stations but have traffic monitoring stations are represented by a grey dot on the map and do not appear in the table.
- Cities with urban and/or suburban background PM2.5 monitoring stations that have reported data with a temporal coverage less than 75% are represented by a grey dot on the map and do not appear in the table.
What is the scientific basis for the different categories of air quality?
We display five categories of air quality, including good, fair, moderate, poor and very poor. These are defined by bandwidths of concentrations of fine particulate matter, as shown below.
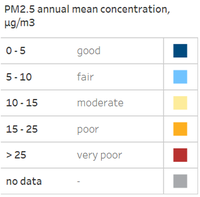
In their guidelines for air quality, the World Health Organization established an annual air quality guideline for PM2.5 exposure of 5 μg/m3, as well as several interim targets. These values have been used to define the bandwidths for the five categories of air quality.
| PM2.5 (μg/m3) |
|---|
| Interim target 1 |
35 |
| Interim target 2 |
25 |
| Interim target 3 |
15 |
| Interim target 4 |
10 |
| Air quality guideline level |
5 |
Source: Adapted from WHO, 2021
What are the uncertainties?
All measurement methods used have a degree of error. In particular, the up-to-date data (dataflow E2a) is not checked for outlying datapoints, which may be errors, and validated by the countries. This may introduce a limited number of more extreme values to the dataset.
In reporting the characteristics of monitoring stations to the EEA, countries may interpret the definitions of station types differently. This can reduce comparability between cities.
It is assumed that all the urban and suburban monitoring stations in a single city represent background environments equally. The methodology does not account for the distribution of the urban population across the city. Treating stations equally may lead to an underestimate of the average concentration that the general population is exposed to, in the case where the area around a pollution hotspot is densely populated.
In large cities with dense urban centres where large parts of the population reside, stations in the city centre are likely to be traffic stations. Such stations are not included in the methodology and this may lead to an underestimation of concentrations of fine particulate matter.
Only measurements from urban and suburban stations that are in the urban audit geometries are considered in the calculations.

Document Actions
Share with others