12. Water quantity
| indicator |
policy issue |
DPSIR |
assessment |
| exploitation index |
how much of the available water do
we consume anyway? |
pressure |
 |
| water use by sector |
how do various sectors contribute
to water quantity problems? |
driving force |
— |
| irrigated area |
how does agriculture contribute to
water quantity problems? |
driving force |
 |
| public water supply |
how does public water supply
contribute to water quantity problems? |
driving force |
 |
Water use by households and industry has
decreased in many EEA member countries. However, water use for
agriculture has increased, especially in southern Europe where it
is a major contributor to water stress.
Water stress, which is pressure on the
quantity and quality of water resources, has a profound
influence on both human activities and the economy. Adequate water
management to ensure reliable water supplies is essential to
support all kinds of human activities and water-dependent
ecosystems. Water abstraction is half the problem, the other half
is related to pollution. This Chapter considers quantity issues,
while quality problems due to nutrients are dealt with in Chapter
13.
Water availability problems occur when the
demand for water exceeds the amount available during a certain
period. They occur frequently in areas with low rainfall and high
population density (mainly around cities and in popular tourist
areas along the Mediterranean coast), and in areas with intensive
agricultural or industrial activity (e.g. the densely populated
areas of north-western Europe). Apart from causing problems
providing water to users, over-exploitation of water has lead to
the drying-out of natural areas in western and southern Europe, and
to salt-water intrusion in aquifers around the Mediterranean
coast.
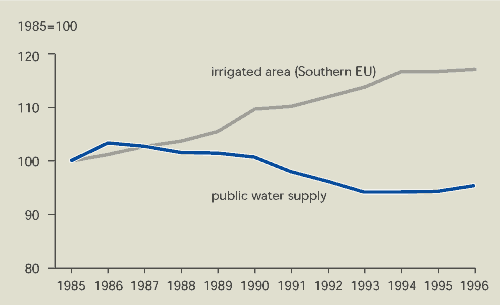
Over the past decade, the amount of water
abstracted for public water supply has fallen by about 10 %
(Figure 12.1). The amount of irrigated farmland in southern
Europe has increased by nearly 20 % during the past 15 years,
leading to a significant increase in water use by agriculture.
Since 1994, however, this trend appears to have levelled off
slightly.
Figure 12.1:
Trends in public water supply and agricultural water use
Source:
EEA-ETC/IW (public water supply); Eurostat/FAO (irrigated area)
Note:
Public water supply data from: Austria, Denmark, Finland, Germany,
the Netherlands and the UK (England and Wales only). Irrigated area
data from: France, Greece, Italy, Portugal and Spain.
 The amount of water abstracted for public water supply has fallen
by about 10 % since 1985.
 Water use by agriculture in southern Europe has increased due to
the marked increase in irrigation over the past 15 years.
12.1. Water resources in Europe
Water resources are unevenly distributed, with
annual average run-off ranging from more than 3 000 mm in western
Norway to 100-400 mm over much of central Europe and less than 25
mm in central and southern Spain. Some countries rely heavily on
water flowing in from across their borders.
To meet their needs, the northern, central and
southern regions abstract, on average, around 1 %, 25 % and 26 %
respectively of their renewable freshwater resources each year.
However, in central Europe, the main use of abstracted water is
cooling water for energy production. Most of this water is returned
virtually unchanged to the water body it was abstracted from and
can be used again. In southern Europe, the main use of abstracted
water is agricultural. Around 80 % of this water is consumed and is
therefore not available for other uses.
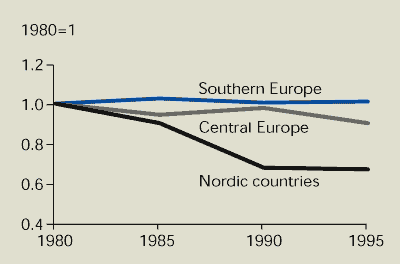
The ratio between total water abstraction and
total renewable water resources in a region, known as the
exploitation index, provides a good indication of water quantity
problems. Figure 12.2 shows that countries in the Nordic and
central regions reduced their exploitation of water between 1980
and 1995 by 30 % and 10 % respectively. In southern Europe,
however, exploitation has remained more or less constant. In 1995,
more than 25 % of renewable water resources were exploited in
Belgium, Germany, Italy and Spain. The exploitation index was
between 10 % and 15 % in Denmark, France, the Netherlands and
Portugal. Austria, Luxembourg and the Nordic countries do not have
problems with exploitation (the index is less than 5 %).
Figure 12.2:
Water exploitation in three European regions
Source:
EEA-ETC/IW
Note: The
water exploitation index is the ratio between total water
abstraction and total renewable resources in a region. Central
Europe: Austria, Belgium, Denmark, Germany, the Netherlands and the
UK. Southern Europe: France, Italy and Spain. Nordic countries
include Sweden and Finland.
 The water exploitation index has decreased in Nordic and
central European countries over recent years. It has remained
stable in southern Europe.
The continued deterioration in the quality and
quantity of water – particularly groundwater – led the European
Council to call for a detailed EU action programme to be drawn up
to protect and manage groundwater as part of an overall policy on
water protection. The draft Groundwater Action and Water Management
Programme (European Commission, 1996) required a programme of
actions aimed at sustainable management and protection of
freshwater resources to be implemented by 2000 at national and
Community level. Many of the draft programme’s recommendations are
included in the proposed Water Framework Directive (European
Commission, 1997).
12.2. Water use by sectors
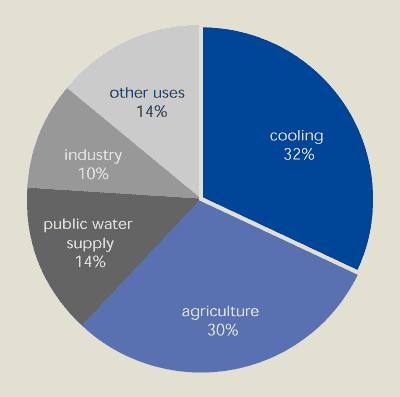
The major uses of abstracted freshwater in the
EEA area are cooling water for power generation and irrigation in
agriculture (Figure 12.3).
Figure 12.3:
Water use in EEA member countries by sector, latest available
year
Source:
EEA-ETC/IW
Note:
Public water supply is used by households and industry. Businesses
with direct water abstraction, e.g. from boreholes, are included in
the industry sector.
| Cooling and agriculture
account for nearly two-thirds of water use in the EEA
area. |
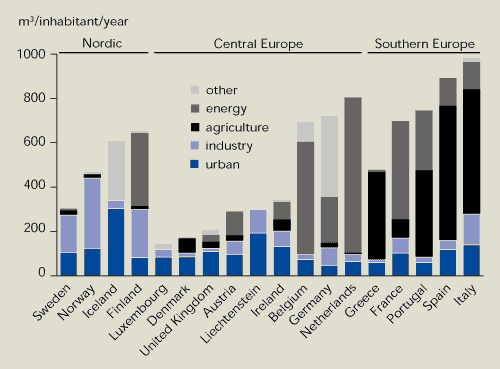
Total abstraction varies from around 200
m3/inhabitant/year in Denmark, Luxembourg and the UK to
more than 800 m3/inhabitant/year in Italy, the
Netherlands and Spain (Figure 12.4). This variation is due to: high
water use by industry in northern countries; the large amounts used
as cooling water in Belgium, France, Germany and the Netherlands
(normally taken directly from large rivers and discharged back
again after use); and high water use for agriculture in southern
countries.
Figure 12.4:
Total water abstraction in EEA member countries by region and by
major uses, latest available year
Source:
EEA- ETC/IW
12.3. Water use by agriculture
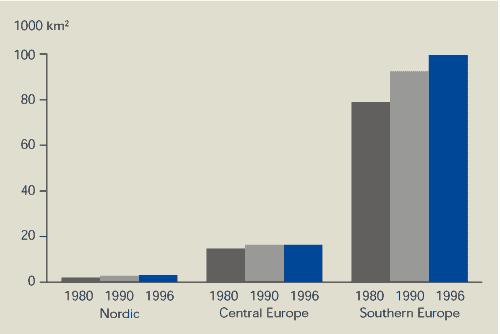
Data on trends in the amount of water used for
irrigation in Europe is not available. A substitute is to consider
the land area subject to irrigation (Figure 12.5). This shows an
increase of about 7 % in the irrigated area in southern Europe
between 1990 and 1996. Figure 6.4 shows particularly rapid growth
in Greece during this period, although Italy and Spain have
experienced the largest absolute growth.
Figure 12.5:
Development in irrigated area in Europe by region, 1980-1996
Source:
FAO/Eurostat
Note:
Nordic: Finland, Iceland, Norway and Sweden. Central: Austria,
Belgium, Denmark, Germany, Ireland, Luxembourg, the Netherlands and
the UK. South: France, Greece, Italy, Portugal and
Spain.
 Irrigated areas have increased during the past 15-20 years,
especially in southern Europe.
Around 94 % of water use for irrigation in the
EU occurs in the south. The amount of water used for irrigation in
Italy and Spain is about 10 times higher than in the central EU
countries combined. France, Greece and Portugal each use about the
same amount of water for irrigation as central EU countries. The
role of irrigation in southern Europe is completely different from
central and northern countries. Irrigation is essential to improve
production in the dry summers of the south. However, reform of the
Common Agricultural Policy should lead to planting of crops with
lower water demands. Introduction of more efficient irrigation
systems should also reduce water use.
Water charges are not generally related to the
true cost (including environmental impact) and are not the same for
all users. This is particularly true for agricultural users, who
are considered to pay very low charges that are related to neither
the quantity used nor the real environmental impact. Economic
instruments – in this case abstraction charges and pricing
mechanisms — are widely regarded as valuable tools for achieving
sustainable water management. Use of economic instruments for
irrigation therefore deserves further attention. Water charges have
been one reason for the decline in water use by households and
industry.
12.4. Water use by households and industry
Public water supply in selected European
countries has declined in the decade from 1985 (Figure 12.6). There
are a number of reasons for this decline, including greater
awareness of water use; water metering; increased water charges and
taxes; restrictions on garden watering; fewer leaks; and widespread
use of more efficient appliances such as low- or dual-flush
toilets
Groundwater is the source of over 75 % of the
water for public water supply in Austria, Denmark, Iceland and
Portugal. In Belgium (Flanders), Finland, France, Germany,
Luxembourg and the Netherlands between 50 % and 75 % of the public
water supply is abstracted from groundwater (Eurostat, 1997).
Groundwater is increasingly preferred for public water supply
because it is generally higher quality than surface water and
requires less treatment. This has led to over-abstraction and a
lowering of the groundwater table in many parts of Europe.
Consequences include: the drying-up of spring-fed rivers, such as
in Denmark; destruction of many wetlands (with examples from 'dry'
countries like Spain and 'wet' countries like the Netherlands); and
salt-water inflow to aquifers along the Mediterranean coast.
Figure 12.6:
Public water supply in selected European countries

Source:
EEA-ETC/IW
Note:
Based on information from Austria, Denmark, Germany, Finland, the
Netherlands and the UK (England and Wales only).
 Public water supply fell by 8-10 % in a number of European
countries between 1987 and 1995.
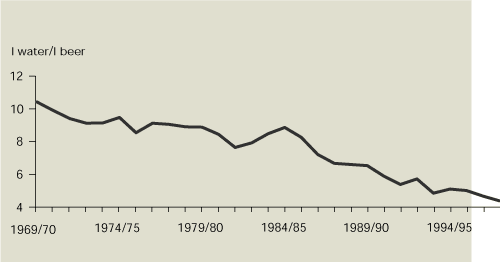
| Brewery water savings cut energy bill |
|
The water-saving target set by Carlsberg in 1977 has resulted in
a 50 % reduction in the amount of water used per litre of beer
produced at its Copenhagen brewery. Washing, pasteurisation and
bottling machines were modified to recycle water, while processes
were systematically revised and modified to encourage water saving.
These changes to machinery and processes saved a total of 200 000
m3/year of water. A similar approach was applied to the brewing
area, where cleaning water is now collected in a tank, pumped
through a filter and re-used. This saves 35 000 m3/year of water
and 400 tonnes/year of sodium hydroxide.
Reducing water use has also allowed Carlsberg to reduce energy
consumption. Effluent leaving the plant tends to be at around
30-35°C, but the temperature of the water entering the plant is
10°C. This temperature difference shows that the water has gained
energy during the process. Reducing the amount of water used also
reduces the amount of effluent, leading to energy savings of
approximately 25 % per litre of beer produced.
|
|
Source: Carlsberg, Denmark
|
12.5. Indicator improvement
Many of the indicators in this Chapter
are not yet available as time series. For existing indicators,
improved harmonisation is needed of data and methodologies for
estimating and reporting water abstractions and water use
(particularly focusing on the treatment of cooling water and water
use for irrigation), including sectoral breakdowns.
For the future, indicators are needed
on the intensity and efficiency of water use (leakage) by
countries, including sectoral breakdowns. Response indicators would
be desirable on the costs of producing water fit for human
consumption and the use of pricing mechanisms (charges) to assure
Cost Recovery Principle which is a cornerstone of European water
policy. Positive indicators on the elimination of subsidies and the
internalisation of pollution costs in prices would also be
desirable.
Analysis of the effectiveness of demand
side vs supply side strategies for alleviating water stress should
be considered, as well as of the effectiveness of the Groundwater
Action Programme and the Drinking Water Directive for improving the
quality of drinking waters.
12.6. Statistics
| Table 12.1: Total
water abstraction per inhabitant in EEA member countries |
| Unit:
m3 per inhabitant per year |
| |
1980 |
1985 |
1990 |
1991 |
1992 |
1993 |
1994 |
1995 |
1996 |
| Austria |
290 |
280 |
|
|
299 |
281 |
|
|
|
| Belgium |
917 |
|
|
|
|
|
|
|
|
| Denmark |
235 |
|
228 |
|
|
|
|
170 |
|
| Finland |
774 |
816 |
471 |
|
|
|
|
479 |
|
| France |
651 |
631 |
675 |
|
|
|
702 |
|
|
| Germany |
686 |
804 |
|
591 |
|
|
|
|
|
| Greece |
523 |
|
|
|
|
|
|
|
|
| Iceland |
439 |
427 |
|
|
626 |
|
|
607 |
|
| Ireland |
315 |
|
|
|
|
|
328 |
|
|
| Italy |
996 |
918 |
|
|
|
|
|
|
|
| Liechtenstein |
|
|
|
|
|
|
|
|
|
| Luxembourg |
|
|
183 |
154 |
Average for 1990-95 is 143. |
| Netherlands |
650 |
638 |
|
518 |
|
|
|
|
|
| Norway |
496 |
|
|
|
|
|
|
|
|
| Portugal |
|
|
735 |
|
|
|
|
|
|
| Spain |
1068 |
1204 |
|
948 |
|
|
|
849 |
|
| Sweden |
494 |
356 |
345 |
|
|
|
|
308 |
|
| UK |
270 |
231 |
211 |
206 |
216 |
194 |
182 |
212 |
198 |
| Source:
OECD |
Note: Denmark:
1977 data given for 1980. France: 1981 data given for 1980.
Germany: 1981 and 1983 data given for 1980 and 1985 data
respectively and for former West Germany only. Netherlands: 1981
and 1985 data given for 1980 and 1985 respectively. Portugal: 1989
data given for 1990. UK data is for England and Wales only and
excludes water abstraction for power generation.
12.7. References and further reading
EEA (1998). Europe’s Environment: The
second assessment. European Environment Agency,
Copenhagen.
EEA (1999a). Groundwater quality and
quantity in Europe. Environmental assessment report No
3. European Environment Agency, Copenhagen.
EEA (1999b). Environment in the European
Union at the turn of the century. Chapter 3.5 Water Stress.
European Environment Agency, Copenhagen.
EEA (1999c). Sustainable water use in
Europe - sectoral use of water. Environmental assessment
report No 1. European Environment Agency, Copenhagen.
European Commission (1996). Proposal for a
European Parliament and Council Decision on an action programme for
integrated groundwater protection and management. COM(96)315
final. European Commission, Brussels.
European Commission (1997). Proposal for a
Council Directive establishing a framework for Community action in
the field of water policy. COM(97)49 final. European
Commission, Brussels.
Eurostat (1997). Estimation of renewable
water resources in the European Union. Luxembourg.


Document Actions
Share with others