Introduction
The decarbonisation of transport is slow compared with that of other economic sectors such as energy supply and industry. Most other sectors have reduced their emissions significantly since 1990, while transport emissions have risen and gained in relative importance. It is, therefore, imperative to make both passenger and freight transport in Europe more efficient and less dependent on fossil fuels. Facilitating a shift towards the lowest-emission transport modes is an important part of this effort. But how do the different modes of transport in the EU (i.e. road, rail, aviation, inland waterway transport and maritime shipping) stack up in terms of their greenhouse gas (GHG) emissions per unit transported? This briefing seeks to answer the question. The results presented here are from a recent study commissioned by the EEA. The study was conducted by Fraunhofer ISI and CE Delft, which had the task of developing a method for reporting on the GHG efficiency of the main modes of transport in Europe.
One objective of the EU and its Member States is to drastically reduce GHG emissions to achieve the objectives of the Paris agreement. This is expressed in the European Green Deal, which sets the ambition to achieve climate neutrality by 2050. For transport, which currently accounts for 24.6% of the EU’s total emissions[1], the European Green Deal calls for a 90% reduction by 2050 compared with 1990. The European Commission’s Sustainable and Smart Mobility Strategy, published in December 2020, calls for ‘decisive action to shift more activity towards more sustainable transport modes’. The strategy identifies a doubling of high-speed rail traffic in Europe by 2030 and a tripling by 2050 as milestones for passenger transport. For rail freight transport, it aims at a 50% increase by 2030 and a doubling by 2050. Freight transport by inland waterways and short-distance sea shipping should increase by 25% by 2030 and 50% by 2050. Reaching these milestones is expected to contribute to a reduction in the environmental pressures from the mobility system. This approach reflects the fact that some forms of motorised transport are more energy efficient and less GHG intensive than others.
All values presented here are ‘well-to-wheel’. This means that both the emissions from the production and distribution of fuels and those from using them are accounted for. As a next step, it would be desirable to also include the emissions from vehicle manufacturing, maintenance and recycling, as well as those related to the construction and maintenance of transport infrastructure. However, for the time being, such a life-cycle analysis is still hampered by a lack of data at European level.
Trains are the best choice for passenger travel
Figure 1 shows a clear hierarchy for motorised passenger travel when it comes to GHG efficiency. The relevant unit is passenger-km (pkm), which means moving one passenger over one kilometre.
Source: Fraunhofer ISI and CE Delft, 2020
Notes: pkm = passenger kilometre; implied car occupancy rate: 1.6
Trains are the most efficient form of passenger transport in the EU, with GHG emissions per pkm that are only a fraction of most other modes. The second most efficient mode is maritime passenger transport. However, the value presented here mainly represents emissions from roll-on/roll-off ferries designed to carry both vehicles and passengers (RoPax). The detailed results show that emissions from other passenger vessel types, such as cruise ships, can be much higher. Taken together, buses and coaches are the most efficient form of road passenger transport. However, the uses of these vehicles vary significantly, which affects their emission performance. Passenger flights and cars are the least efficient forms of passenger transport and produce the highest emissions per pkm.
The results suggest that aviation and rail passenger transport efficiency improved by 12% and 13% respectively over the period from 2014 to 2018. For rail, this is mainly the result of the electrification of the rail network and the declining carbon intensity of the EU’s electricity mix. For aviation, the gains owe largely to the uptake of more efficient aircraft. The GHG intensity of car travel only improved marginally over the period in question. For bus and coach travel, GHG efficiency appears to have declined.
Vast efficiency differences in freight transport
GHG efficiency rates for freight transport vary much more than those for passengers. So much so that a logarithmic scale was used in the left part of Figure 2. The relevant unit is tonne-km, which means moving the payload of one tonne over one kilometre.
Figure 2: Average GHG emissions by motorised mode of freight transport, EU-27, 2014-2018
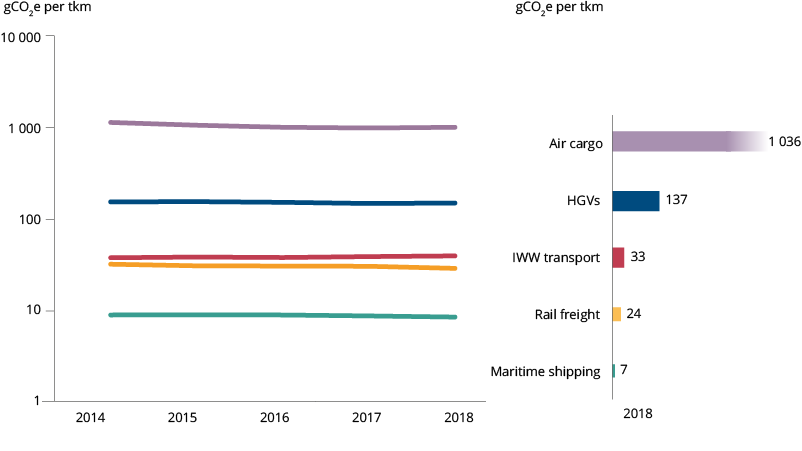
Source: Fraunhofer ISI and CE Delft, 2020
Note: logarithmic scale used in left chart; tkm = tonne kilometre
Emissions for freight transported by maritime shipping, rail and inland waterway are very low compared with those for freight transported by heavy goods vehicle (HGV). Air cargo stands out as the mode with the highest emissions by far. However, over the 2014-2018 period, air cargo saw the biggest GHG efficiency improvement (12%) followed by rail freight (11%). Similar to passenger transport by air and rail, more efficient aircraft and the electrification of railway lines are behind this trend. HGVs only showed a slight improvement of 3%.
The results presented above fully confirm the assumptions underpinning the EU’s modal shift policy. However, not all modes are equally suited to all transport tasks. Therefore, it is not always possible to substitute one mode of transport for another. Issues related to geography (e.g. transport over water), the availability of infrastructure, as well as time criticality (e.g. for express delivery or perishable goods) limit what is possible. In addition, the most efficient motorised transport modes can only be used between transport hubs such as ports and rail freight terminals and, therefore, only function in combination with other modes.
Method and data
In this briefing, the efficiency figures are presented at the highest level of aggregation. The study itself drills down into different market segments, vehicle and vessel categories, propulsion systems and fuels. Although all values have been calculated as accurately as possible given the available data, they may be subject to revision. It is also important to understand that they can only ever be as reliable as the data underpinning them and the accuracy of assumptions, which also depend on existing data and research. Finally, the 5-year span from 2014 to 2018 is insufficient to document long-term efficiency trends. It was a conscious choice that the study would prioritise comparable and consistent data across modes over having a long time series. It is, nevertheless, important to keep track of how the GHG efficiency of modes evolves over time. As such, it is envisaged that the method developed in the study could underpin an EEA indicator with regular updates in future.
This is not the first time such figures have been produced. However, previously published figures are often outdated and suffer from the absence of coherent input data across modes. Another shortcoming is the often-incomplete application of a well-to-wheel perspective. All values presented above are well-to-wheel or well-to-wake, which is the equivalent expression for aviation and shipping. They are expressed in grams of carbon dioxide equivalent (gCO2e) and cover the EU-27 (i.e., the 27 EU Member States as of 1 February 2020). For aviation, a Global Warming Potential (GWP) weighted emissions factor of 1.7 was applied to the direct CO2 emissions from flights to take account of the so-called non-CO2 radiative forcing effects of aeroplane emissions. The factor of 1.7 relates to a 100-year GWP and comes from a recent study commissioned by the European Commission on the topic. For maritime shipping, the climate impacts of black carbon emissions are included, in-line with the findings of the 4th IMO GHG study.
The results are primarily intended as a baseline for measuring progress and for informing policy choices at the EU level. However, a well-informed policy will not be solely based on GHG efficiency but will consider the full spectrum of potential environmental and health impacts. Finally, the average values presented in the briefing should not be used for calculating GHG emissions for specific trips. Emissions per km for some modes, especially for aviation, are distance dependent. Also, the GHG intensity of electricity differs significantly across EU Member States.
Identifiers
Briefing no. 01/2021
Title: Rail and waterborne — best for low-carbon motorised transport
HTML - TH-AM-21-001-EN-Q - ISBN 978-92-9480-364-1 - ISSN 2467-3196 - doi: 10.2800/817894
PDF - TH-AM-21-001-EN-N - ISBN 978-92-9480-363-4 - ISSN 2467-3196 - doi: 10.2800/85117

Document Actions
Share with others