Chapter 4. Nitrogen emissions and threats to biodiversity
• Nitrogen emissions and threats to biodiversity
• Conserving natural habitats in Europe as one way to increase resilience
• Improving resource efficiency to reduce nutrient emissions
• The agriculture sector and low-input farming as part of a green economy
Chapter 5. Carbon emissions and climate change
• Carbon emissions and climate change
• Limiting disturbances to the climate system to ensure ecosystem resilience
• Reducing greenhouse gas emissions is essential for achieving a low-carbon economy
• The energy sector plays a key role in facilitating a move to a low-carbon economy
Chapter 6. Air pollution and air quality
• Air pollution and air quality
• Achieving levels of air quality that secure a safe and resilient living environment
• Using atmospheric resources more efficiently by reducing air pollution
• The transport sector offers scope to reduce air pollution further in a green economy
Chapter 7. Maritime activities and the marine environment
• Maritime activities and the marine environment
• Managing the marine environment using more resilient, ecosystem-based approaches
• Improving resource efficiency in maritime sectors: shipping
• The fisheries and aquaculture sector depend critically on resilient ecosystems
Chapter 8. Water use and water stress
• Water use and water stress
• Maintaining good ecological status of water bodies is key to ecosystem resilience
• Managing water use and demand to improve efficiency in all sectors
• Public water supply sectors: water pricing and other incentives to save water
Chapter 9. Use of material resources and waste management
• Use of material resources and waste management
• Acknowledging limits in the supply of renewable and non-renewable resources
• Decoupling economic growth from material consumption
• Managing waste to encourage the shift towards a recycling society and a green economy
4. Nitrogen emissions and threats to biodiversity
Threats to biodiversity are manifold. The key factors driving biodiversity loss in Europe include habitat change, the establishment and spread of invasive alien species, pollution, over-exploitation and increasing impacts of climate change. All are closely linked to economic activities. This chapter focuses on one of these drivers: pollution (as exemplified by nitrogen emissions).
Nitrogen emissions can have significant harmful effects on sensitive ecosystem areas by exposing them to acidification and eutrophication resulting from nitrogen pollution in the atmosphere and water bodies. Other nutrients (such as phosphorous and sulphur) may have similar effects and are also major pollutants but are not discussed here.
The following EEA indicators are highlighted in this chapter: 'Habitats of European interest' (SEBI 05), 'Species of European interest' (CSI 07/SEBI 03) and 'Exposure of ecosystems to acidification, eutrophication and ozone' (CSI 05) as proxies for ecosystem resilience; and 'Emissions of acidifying substances' (CSI 01) as a proxy for resource efficiency. Also, indicators on 'Gross nutrient balance' (CSI 25) and 'Area under organic farming' (CSI 26) illustrate progress to low-input agriculture in a green economy.
The indicator on conservation status of habitats and species of European interest, although not comprehensive, provides an overview of biodiversity loss in Europe. An unfavourable status illustrates that the resilience of sensitive ecosystems may be under threat.
Other related EEA indicators and reports include (see Annex):
• Indicators and indicator sets: Streamlining European Biodiversity Indicators (SEBI), agriculture (including CSI 25, CSI 26)
• Assessing biodiversity in Europe — the 2010 report (EEA,2010a)
• EU 2010 biodiversity baseline (EEA, 2010b)
Nitrogen emissions and threats to biodiversity
Pollution is one of five major threats to Europe's biodiversity. The principal pressure is habitat fragmentation, degradation and destruction due to land-use change. Other key drivers of biodiversity loss are the establishment and spread of invasive alien species, over-exploitation, and increasing impacts of climate change (EEA, 2010a). The relative importance of these pressures varies from place to place and very often several pressures act in concert (CEC, 2006; EEA, 2010b). Impacts from these and other human activities can interact and have amplified and cascading effects on biodiversity and ecosystem structure and function.
While all forms of pollution pose a serious threat to biodiversity, nutrient loading — particularly of nitrogen (in the form of reactive nitrogen) and phosphorus — is a major and increasing cause of biodiversity loss and ecosystem dysfunction (EEA, 2010b). Nutrient loading has increased substantially over the course of the past century. To fuel agricultural and industrial development, humans have caused unprecedented changes to the global nitrogen cycle and introduced excess reactive nitrogen into environmental systems (Figure 4.1).
Reactive nitrogen is generally scarce in the natural environment, occurring as nitric acid, ammonia, nitrates, ammonium and organic nitrogen compounds. It is artificially produced, however, by converting inert nitrogen gas during fertiliser production and fuel combustion. Estimates show that the total 'fixation' of various forms of reactive nitrogen has doubled globally since the pre-industrial era, and more than tripled in Europe (EEA, 2010c). Excess reactive nitrogen causes air pollution and eutrophication of terrestrial, aquatic and coastal ecosystems.
Generally speaking, in terrestrial ecosystems the introduction of excessive reactive nitrogen triggers the loss of sensitive species and hence loss of biodiversity, by favouring a few nitrogen tolerant species over a greater number of less tolerant ones. In freshwater and coastal ecosystems, it causes additional (indirect) negative effects such as reductions in the amount of dissolved oxygen in the water and damaging changes to fish and other animal and plant populations, as well as algal blooms and deoxygenated dead zones in which only a few bacterial species may survive (EEA, 2010b).
It is worth noting that significant geographical variability occurs in emissions and deposition of nitrogen compounds. Nevertheless, both separately and in combination, atmospheric nitrogen deposition and eutrophication via nitrogen discharge to water bodies represent major threats to biodiversity and serious challenges for the conservation of natural habitats across Europe (EEA, 2010b).
Box 4.1 Reactive nitrogen
Nitrogen, in the form of N2 gas, makes up almost 80 % of the atmosphere. This nitrogen is only available to plants and animals in the food web if it is first 'fixed' into reactive forms by micro-organisms. This natural fixation process is supplemented by industrial production of nitrogenous fertiliser. Fossil fuel combustion, which emits additional amounts of nitrous oxide, further increases the load of reactive nitrogen (EEA, 2010c).
Figure 4.1 Simplified view of the nitrogen cascade
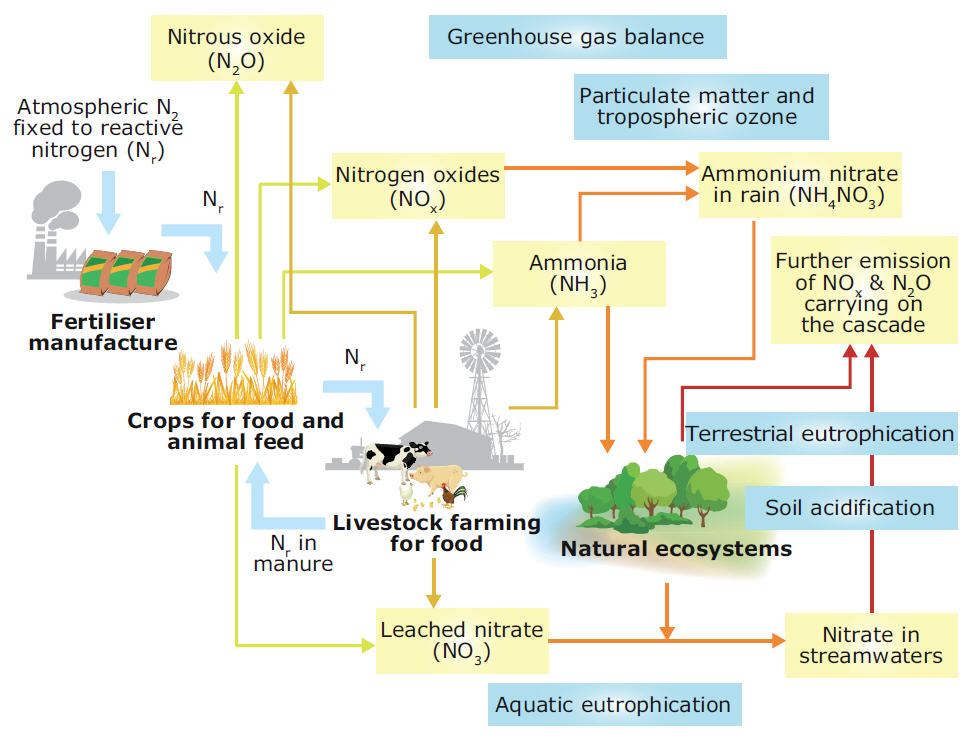
Note: This figure highlights the major anthropogenic sources of reactive nitrogen (Nr) from atmospheric nitrogen (N2), the main pollutant forms of Nr (yellow boxes) and related environmental concerns (blue boxes)
Source: Based on Sutton et al., 2011.
Conserving natural habitats in Europe as one way to increase resilience
Pollution, including by nitrogen, combines with other pressures such as habitat change, invasive species, over-exploitation and climate change, to undermine ecosystem resilience and cause biodiversity loss in Europe (EEA, 2010a). In combination, these pressures result in a significant proportion of European species and habitats facing negative prospects or even extinction. This constitutes a risk to, and reflects the status of, overall ecosystem resilience.
In particular, agricultural and aquatic ecosystems are under considerable pressure from nitrogen pollution. Half of agro-ecosystems and a third of lake and river ecosystem habitats of European interest have an unfavourable conservation status (Figure 4.2). Fertiliser use arising from agricultural intensification, along with other related changes, is one of the main pressures with negative effects on agro-ecosystems and associated biodiversity (EEA, 2010f). Pollution of watercourses is also one (of two) main threats to the biodiversity of lakes and rivers, and nitrogen discharge to surface waters from agriculture is a key pollutant in most Member States (EEA, 2010b).
Figure 4.2 Conservation status of agro-ecosystem (left) and lake and river ecosystem habitats of European interest (right)
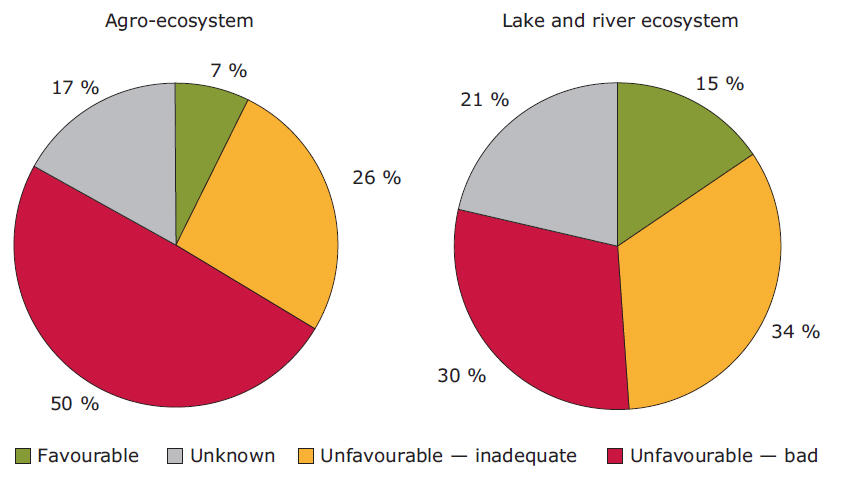
Source: EEA, 2010b, adapted from SEBI 05.
An indicative measure of the degree to which pollution compromises the resilience of natural and semi-natural ecosystems is the exceedance of 'critical loads'. A critical load is defined as 'a quantitative estimate of an exposure to one or more pollutants below which significant harmful effects on specified sensitive elements of the environment do not occur according to present knowledge' (UNECE, 2004).
Excess deposition of air pollutants can lead to disturbances in the function and structure of ecosystems and contribute to the acidification of soils and freshwaters. The negative effects of acidification are leaching of plant nutrients from soils and damage to flora and fauna. At the same time, deposition of nitrogen compounds can lead to an oversupply of nutrient nitrogen and eutrophication in terrestrial and water ecosystems, which can result in changes in vegetation abundance or leaching of nitrate to groundwater.
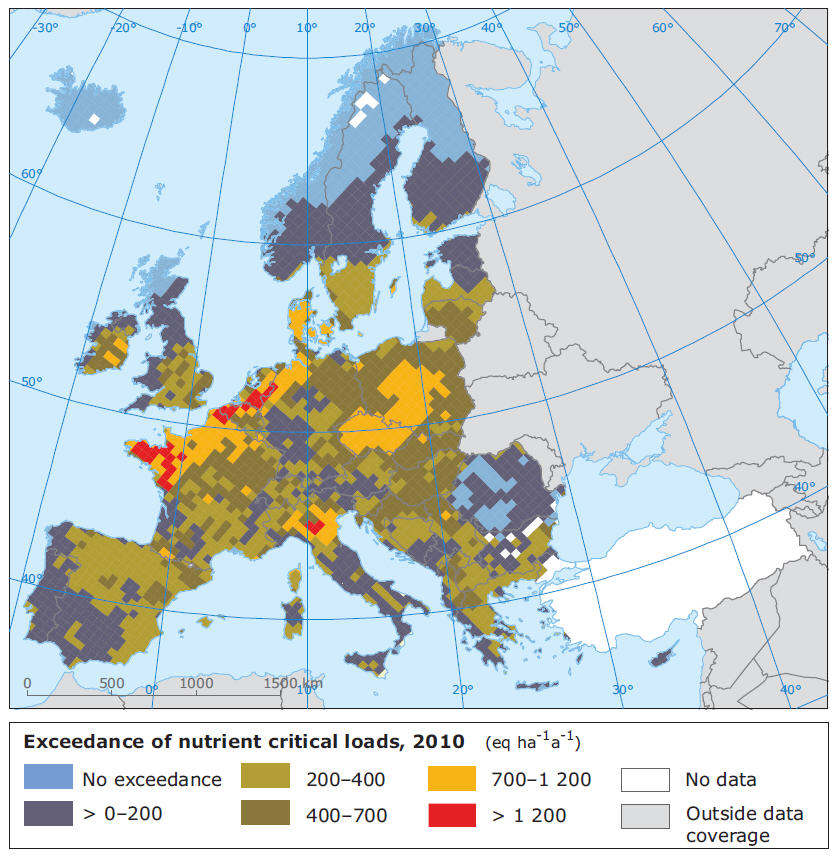
Despite substantial reductions in nitrogen pollution from key polluting sectors and sources over the last two decades, critical nitrogen loads are still being exceeded throughout much of Europe. It is estimated that in 2010 more than 40 % of sensitive terrestrial and freshwater ecosystem areas were subject to atmospheric nitrogen deposition above the critical loads (Map 4.1).
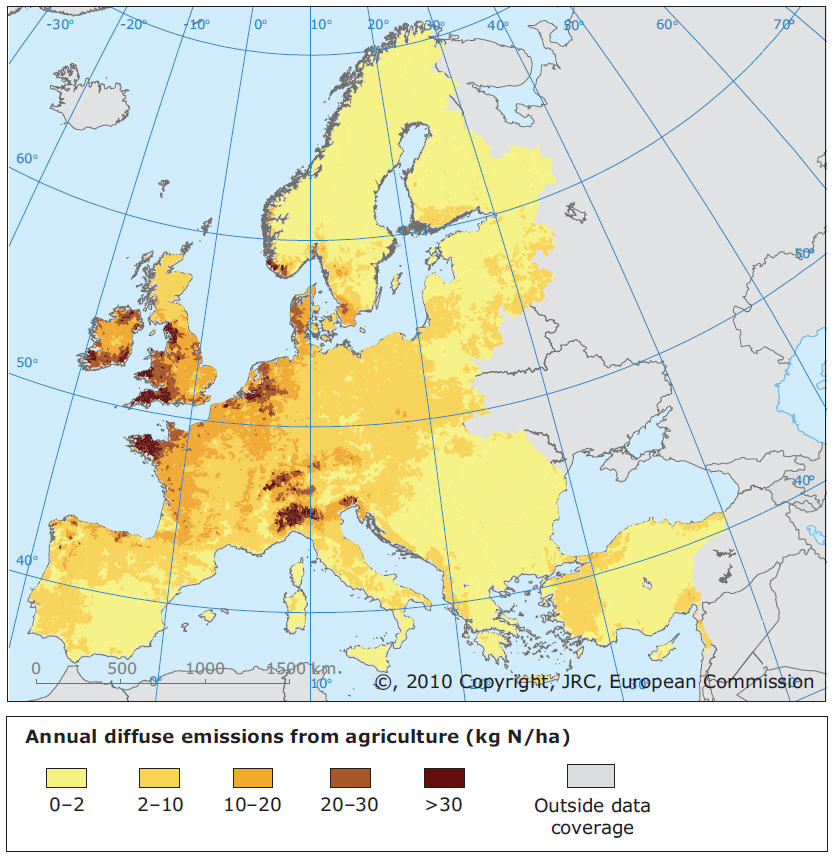
Nitrogen pollution from agricultural inputs (for example due to fertiliser application) is now the primary driver of anthropogenic changes to the N cycle. It is both a substantial source of reactive nitrogen to soil and air, and also contributes 50–80 % of the total nitrogen load transported into Europe's freshwater ecosystems and, ultimately, coastal waters and seas (EEA, 2010d).
The overall reductions in pollution and nutrients from wastewater treatment discharges, industrial effluent and agricultural run-off into rivers, lakes and groundwater has generally reduced the stress on freshwater biodiversity and improved the ecological status. Still, impacts on freshwater persist and, as such, many EU water bodies may not achieve good ecological status as required by the Water Framework Directive (2000/60/EC) (Map 4.2).
Map 4.1 Conservation status of agro-ecosystem (left) and lake and river ecosystem habitats of European interest (right)
Note: Figures for 2010 are model based and were computed using the 2008 Critical Loads Database hosted by the Coordination Centre for Effects (CCE).
Source: CSI 05 indicator, based on Hettelingh et al., 2008.
Map 4.2 Exceedance of the critical nitrogen loads for eutrophication in Europe, 2010
Improving resource efficiency to reduce nutrient emissions
Following the peak production of reactive nitrogen in Europe during the 1980s, levels of nitrogen pollution have declined as a result of policies and regulations (for example the Nitrates Directive (91/676/EEC)) and have now stabilised, albeit at relatively high levels.
Production of reactive nitrogen in Europe in 2008 was about 34 Tg (5), of which 75 % was for synthetic fertiliser and 25 % for the chemical industry (i.e. production of rubbers, plastics, and use in electronic, metals and oil industry). This translates into annual nitrogen emissions of some 15 Tg. Roughly speaking, about half of this reactive nitrogen is released to water bodies, under a quarter each takes the form of atmospheric nitrous oxide (NOX) and ammonia (NH3) emissions, and the remainder is attributed to atmospheric N2O emissions (Sutton et al., 2011).
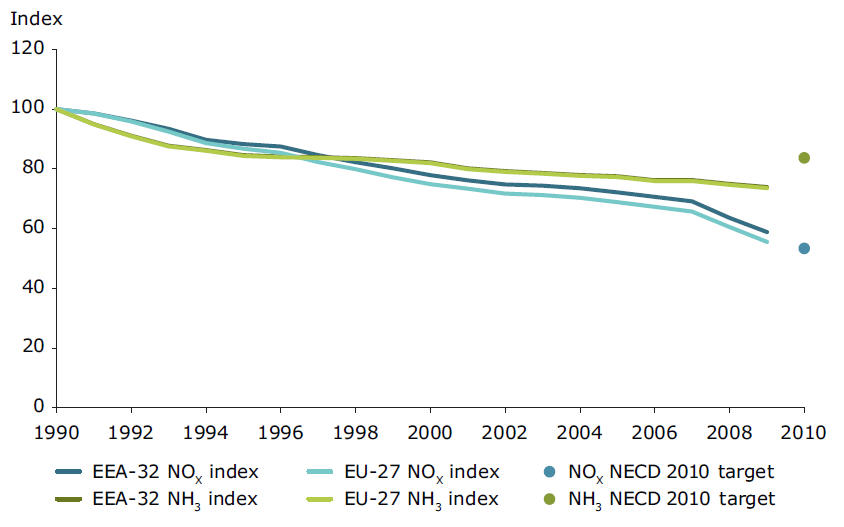
Emissions of nitrogen oxides and ammonia to the atmosphere have decreased significantly since 1990 across most of the EU. NH3 emissions decreased by 26 % in the period 1990–2009, mostly due to a reduction in livestock numbers in the agricultural sector (especially cattle), changes to manure management and decreased use of nitrogenous fertiliser. NOX decreased by 41 % mostly due to flue-gas abatement techniques in the energy sector and combustion modification technologies in the transport sector. As a result of these reductions, the EU-27 is on track to meet its overall target of reducing atmospheric emissions of NH3 as specified by the National Emissions Ceilings Directive (2001/81/EC), although some Member States may not reach the targets for NOx (CSI-001) (Figures 4.3 and 4.4).
Figure 4.3 Emissions of acidifying/eutrophying pollutants to air from 1990 to 2009
Source: CSI 01 indicator.
Figure 4.4 Sectoral contributions of air emissions of acidifying pollutants in EEA member countries
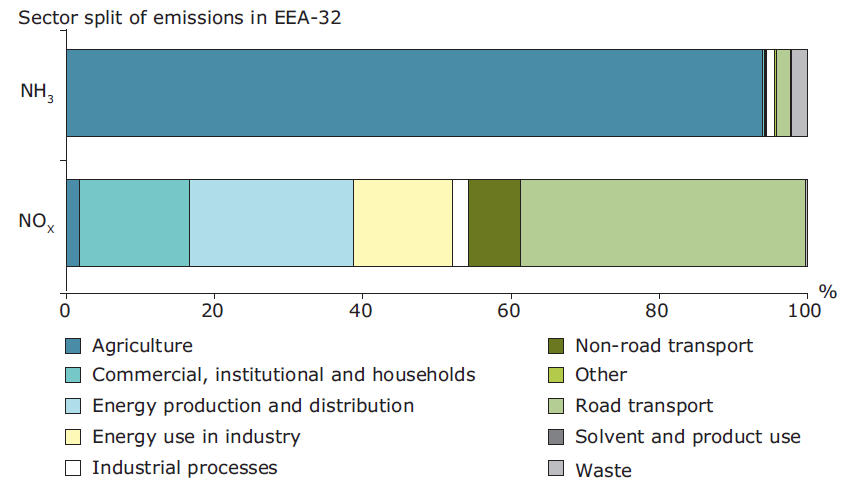
Source: CSI 01 indicator.
Nutrient levels in freshwaters are also slowly decreasing. The average nitrate concentration in European rivers decreased approximately 10 % between 1992 and 2008. This decrease reflects, in particular, the effect of measures to reduce agricultural inputs of nitrate (see the EEA CSI 20 indicator). Due to cumulative effects of reactive nitrogen inputs and long time lags, recovery is expected to occur gradually. Reported timescales for substantial restoration of water quality expected to result from full implementation of current corrective measures under the Nitrates Directive (91/676/EEC) range from four to eight years in Germany and Hungary, to several decades for deep groundwater in the Netherlands (EEA, 2010d).
While nitrogen pollution by the energy and transport sectors is expected to continue declining, agriculture is now identified as the sector with the largest remaining emission reduction potential (Sutton et al., 2011).
The agriculture sector and low-input farming as part of a green economy
Human production of reactive nitrogen has greatly contributed to the increase in productivity of agricultural land. At the same time, agriculture is also one of the largest drivers of genetic erosion, species loss and conversion of natural habitats, undermining the biodiversity and ecosystem services upon which it critically depends. The wide variety in nitrogen application rates and nitrogen use efficiency across Europe indicates that there is considerable scope to improve resource efficiency and reduce environmental effects in this respect.
Without fertilisation, a hectare of good agricultural land in Europe, with no other growth limitations, can produce about two tonnes of cereal per hectare (ha) annually. By harnessing biological nitrogen fixation, this increases to about four to six tonnes per ha, and with addition of synthetic (nitrogen and phosphorous) fertiliser to about eight to ten tonnes per ha. Consequently, it has been argued that synthetic fertilisers are essential for sustaining nearly half of the world population (Sutton et al., 2011).
Estimates show, however, that the annual reactive nitrogen added to agricultural soils (primarily from synthetic fertilisers and manure) exceeds requirements for crop production by approximately 10 Tg each year (Sutton et al., 2011). Despite reductions achieved since the 1980s, most countries still record a nitrogen surplus of at least 30 kg per hectare of total agricultural land — with values in excess of 100 kg per hectare in several countries (Figure 4.5). In producing food for the European population (not including imported food and feed), annual reactive nitrogen emissions to the environment have been estimated to correspond to a nitrogen use efficiency of about 30 % (Sutton et al., 2011).
Figure 4.5 Average nitrogen surplus in the years 2000–2004 and 2005–2008 (kg N/ha agricultural land)
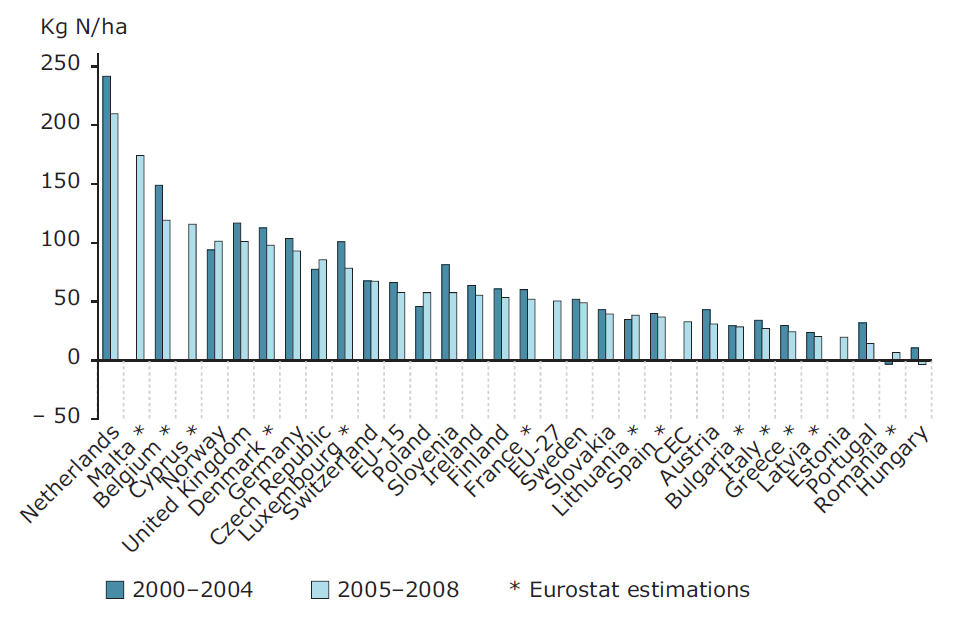
Source: SEBI 19 indicator, updated based on Eurostat data.
The future challenge is to achieve further reductions in agricultural nitrogen surplus from current levels, and at the same time meet increasing global food needs. In support of meeting this overall challenge, three key actions for the agricultural sector can be identified that are critical to reducing nitrogen pollution: improving nitrogen use efficiency in crop production, improving nitrogen use efficiency in animal production, and increasing the fertiliser equivalence value of animal manure (Sutton et al., 2011).
Box 4.2 Costs and benefits of nitrogen fertilisers
Reactive nitrogen from agriculture in the EU-27 has been estimated to cause environmental damage worth EUR 20–150 billion annually. Meanwhile, N-fertiliser use by farmers is estimated to result in benefits of EUR 10–100 billion per year. This means that costs and benefits are of a comparable order of magnitude (Sutton et al., 2011) but it is uncertain whether there is a net benefit or cost.
'Low input' farming systems, such as organic farming, may play a role in responding to the future challenge. These farming operations have the potential to support biodiversity by reducing nitrogen (and other) pollution (e.g. Kramer et al., 2006), as well as providing other potential benefits associated with rotation practices or extensive farming approaches utilised in such systems (EEA, 2010e). Organic farming has developed rapidly since the beginning of the 1990s so that by 2004 6.5 million ha in Europe were managed organically (by around 167 000 farms). Between 2005 and 2008, the area of land under organic farming practices in the EU increased by 21 % (Figure 4.6).
Figure 4.6 Share of organic farming in total utilised agricultural area in 2000 and 2007
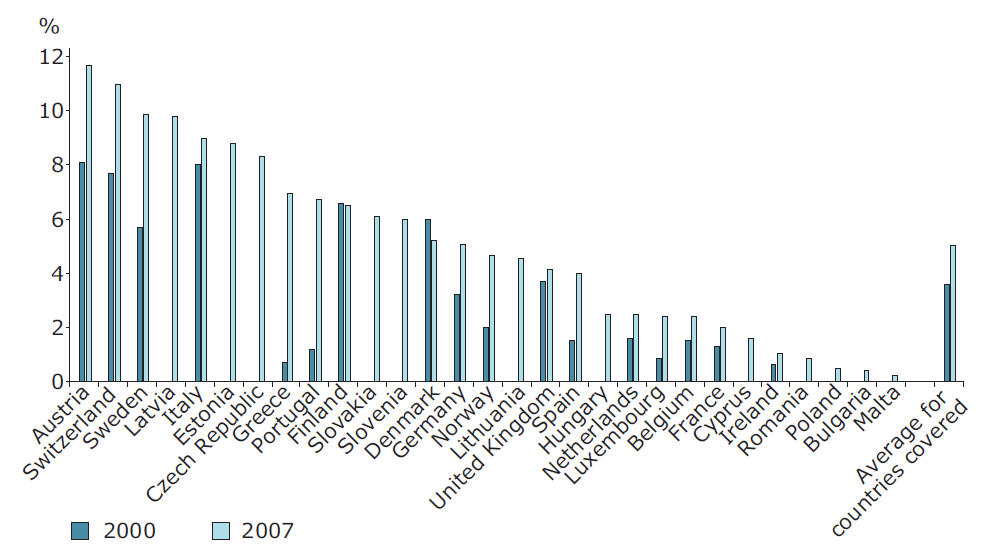
Source: SEBI 20 indicator.
Although organic farming systems offer one mechanism for reducing inputs and emissions of reactive nitrogen from agriculture and subsequent impacts on the environment, the relative productivity can be lower than agricultural land managed under conventional farming practices. Modifications to 'low input' farming techniques will be necessary to improve productivity and efficiency further, while maintaining reduced impacts on biodiversity and ecosystems. Such improvements will represent one of the many actions needed to ensure the resilience of Europe's biodiversity.
Box 4.3 Reform of the Common Agricultural Policy
The Common Agricultural Policy (CAP) has been in place since 1962 and has been regularly revised to meet changing needs. Some of these changes are apparent in the disbursement of agricultural subsidies, with European farmers no longer paid only for the production of food but also for providing environmental services to the public.
Currently about 40 % of the total EU budget is spent on CAP measures. Although considerable, this is a reduction from the earlier years of the CAP when more than half of the EU budget was paid out to the agricultural sector. In 1985, for example, around 70 % of the EU budget was spent on agriculture (EC, 2012).
In October 2011, the European Commission presented the CAP reform proposal for the period 2014–2020 with the aim of making the CAP a more effective policy for more competitive and sustainable agriculture. The reform proposal maintains the existing funding scheme of the CAP, which distinguishes between two pillars: production support and rural development. It is proposed, however, that the direct payment scheme be redesigned, with a new 'basic payment scheme' in place after 2013 and subject to 'cross compliance', i.e. requiring that recipients respect certain environmental, animal welfare and other rules.
The legal proposal also includes new concepts, including a mandatory 'greening' component of direct payment, which will support agricultural practices beneficial to the climate and the environment throughout the EU. For that purpose, Member States should use part of their national ceilings for direct payments to grant an annual payment, on top of the basic payment, for compulsory practices to be followed by farmers addressing, as a priority, both climate and environment policy goals.
5. Carbon emissions and climate change
Our economies rely heavily on fossil fuels. The resulting emissions of carbon dioxide and other greenhouse gases into the atmosphere (in 2008 this amounted to about 47 Gt CO2-equivalent globally) substantially alter the global climate system. These alterations put at risk the stable climate regime which our societies rely on: average global air temperature over Europe's land area has increased by more than 1 °C over the past 100 years.
This chapter focuses on three indicators hosted by EEA: 'Global and European temperature' (CSI 12) as a proxy for disturbances to the climate system that may undermine ecosystem resilience; 'Greenhouse gas emission trends' (CSI 10) as a proxy for resource efficiency; and 'Renewable primary energy consumption' (CSI 30) which illustrates progress in increasing the share of renewable energy sources.
Changes in global and European temperatures are one of several indicators to describe climate change. Such indicators can illustrate how sensitive the climate system is to human activities — and how close we may be to 'dangerous' climate change that would endanger the structure and function of ecosystems and undermine their resilience to other stress factors.
Reductions in greenhouse gas emissions trends are not a direct indicator of resource efficiency. They do, however, offer a clear proxy for the combined pressures exerted on the climate system by our use of resources to supply, for example, energy, food, housing and transport. Substituting fossil-based energy sources with renewables is a key factor in improving energy efficiency, with respect to reducing environmental impacts.
Other related EEA indicators and reports include (see Annex):
• Indicators and indicator sets: climate change (CLIM), energy (ENER), and transport (TERM)
• GHG emission trends and projections in Europe (EEA, 2012a)
• Impacts of Europe's changing climate (EEA, 2012b)
Carbon emissions and climate change
Our economies rely heavily on fossil fuels. Global emissions of greenhouse gases due to human activities have grown drastically since pre-industrial times, including an increase of more than 70 % over the past four decades (IPCC, 2007). In 2008, global annual emissions were about 47 Gt of carbon dioxide equivalents (CO2-eq) (JRC and PBL, 2011). Under business-as-usual projections, this is expected to increase to 54–60 Gt CO2-eq by 2020. It has been estimated that even if international reduction pledges are fully implemented this range is lowered by only 3–7 Gt CO2-eq (6) (UNEP, 2011).
Much of this is due to carbon emissions, which alter the global carbon cycle substantially, increase in atmospheric carbon concentrations (CO2-eq concentrations are nearly 60% higher than pre-industrial levels, see CSI 13) and result in changes to the climate system (7). These changes (and associated temperature and precipitation changes, sea level rise and extreme events) have both direct and indirect effects on ecosystems, water resources, food security, human health, settlements and, more generally, socio-economic development (Figure 5.1).
The climate system's ability to absorb carbon dioxide and other greenhouse gas emissions — and to provide a reliable and stable average temperature regime — is thus an important, globally shared environmental resource. The significant rise in emissions over the past century undermines the climate system's capacity to absorb emissions without resulting in less stable climatic conditions. In other words, without substantial emission reductions, disturbances to the climate system may increase, and undermining ecosystem resilience.
The majority of anthropogenic carbon emissions stem from the use of fossil fuels, plus a substantial contribution due to deforestation, land use and land cover changes. Across the globe, the energy supply, housing, industrial and transport sectors together account for about two thirds of emissions, with agriculture and forestry (including deforestation) combined adding more than 30 % (IPCC, 2007). In Europe, the main contributions are from energy production (about 30 %) and transport (about 20 % (8)) (EEA, 2011a).
Despite successful efforts to reduce emissions in Europe overall and a noteworthy decrease in the European share in global emissions, total global greenhouse gas emissions continue to grow. In 2008, the European Union (home to about 7 % of the world population) produced about 5 Gt CO2-eq (9) or 11 % of the world's total emissions (JRC and PBL, 2011). By comparison China produced about 10 Gt CO2-eq (21 % of total world emissions) in 2008, the United States of America produced around 6.6 Gt CO2-eq (14 %), and the Russian Federation and India each produced around 2.5 Gt CO2-eq (5 %) (JRC and PBL, 2011).
Figure 5.1 Schematic framework representing anthropogenic climate change drivers, impacts and responses, and their links
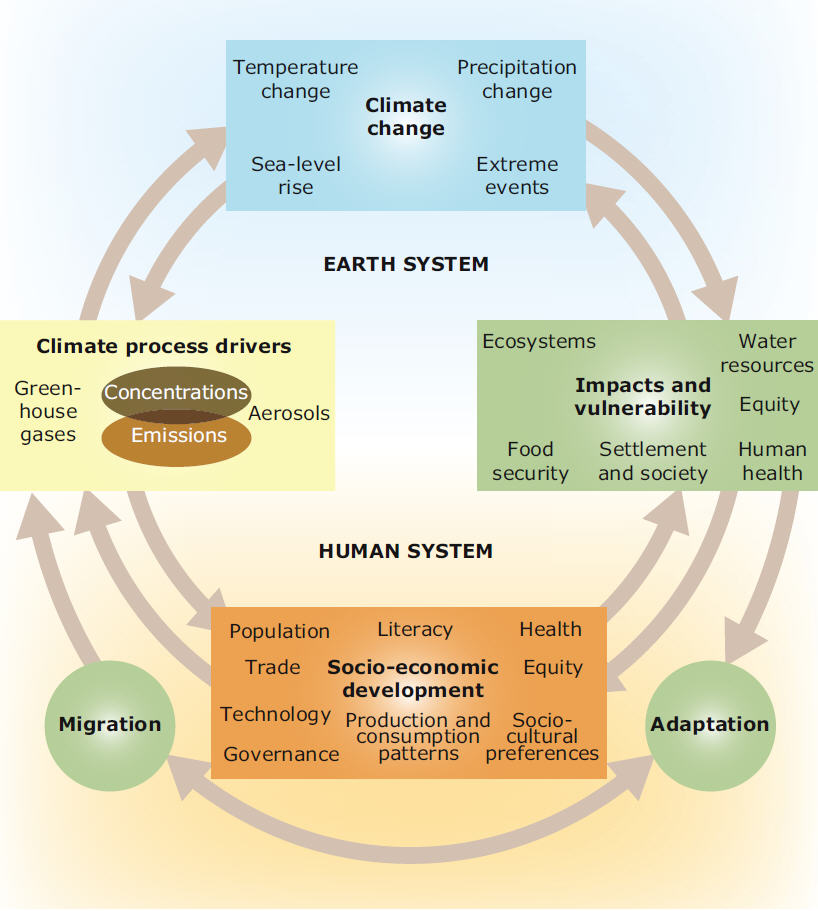
Source: Based on IPCC, 2007.
Limiting disturbances to the climate system to ensure ecosystem resilience
In order to avoid 'dangerous interference with the climate system', the international community has agreed to limit the global mean temperature increase since pre-industrial times to less than 2 °C (the '2 °C target'). Since the 2 °C target does not avoid all adverse climate change impacts, limiting global temperature increase to 1.5 °C is also being considered (UNFCCC, 2009) (10).
Temperature changes provide a proxy indicator for disturbances to the climate system and to climate-sensitive systems and sectors. Since the beginning of the 20th century, average global air temperature has increased by more than 0.7 °C, and in the first ten years of the 21st century alone the measured increase has exceeded 0.2 °C. Furthermore, best estimates of current projections suggest that global mean temperatures could rise by as much as 1.1–6.4 °C over the course of this century if global action to limit greenhouse gas emissions is unsuccessful (see CSI 12).
Figure 5.2 European temperatures, 1850–2011 — annual average and 10-year running average
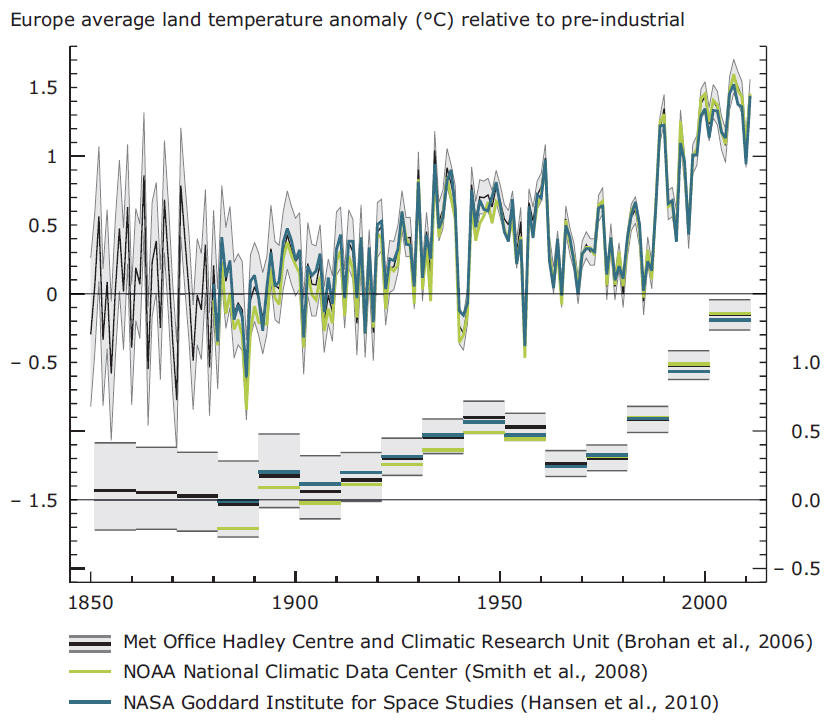
Note: The upper graph and left axis show annual anomalies and the lower graph and the right axis show decadal average anomalies for the same datasets. The figure compares three analyses of observations. The black line refers to data from HadCRUT3 from the UK Met Office Hadley Centre and University of East Anglia Climate Research Unit, baseline period 1850–1899 (Brohan et al., 2006). The green line refers to data from GHCN-M version 3.1.0 from the US National Oceanic and Atmospheric Administration (NOAA) National Climatic Data Centre, baseline period 1880–1899 (Smith et al., 2008). The blue line refers to data from GISSTemp from the National Aeronautics and Space Administration (NASA) Goddard Institute for Space Studies, baseline period 1880–1899 (Hansen et al., 2010).
Source: CSI 12 indicator.
Europe has warmed more than the global average. Decadal average temperature over European land areas increased by approximately 1.3 °C between pre-industrial times and the decade of 2002 to 2011 (Figure 5.2). Considering the European land area, nine out of the last 12 years were among the warmest years since 1850. The average temperature over Europe is projected to continue increasing over the next century, probably even faster than the global average temperature (van der Linden, 2009; CSI 12).
Within Europe, the largest temperature increases are seen in southern Europe and the Arctic. Precipitation has reduced markedly in southern Europe and increased in the north and north-west. At the same time, high temperature extremes, including heat waves, have become more frequent, and their intensity and frequency is projected to increase further. In addition, increases in flooding events, shifts in habitats for many species and changes in the distribution of some infectious diseases and pollen are expected.
Overall losses resulting from weather- and climate-related events have increased considerably during the last 25 years. The increase in losses can be largely explained by higher levels of human activity and accumulation of economic assets in hazard-prone areas, and also, to a smaller extent, by better reporting. Nevertheless, changing patterns of weather extremes also play a role. The share of losses attributable to climatic change is currently impossible to determine accurately but it is likely to increase as the frequency and intensity of many weather extremes is projected to grow.
Climate change is a stress factor for ecosystems, putting their structure and functioning at risk, and undermining their resilience to other stressors. As such, climate change also threatens societies and economies that depend on ecosystem goods and services. Dedicated adaptation measures are needed to build resilience against climate change impacts: even if European and global emission reductions efforts over the coming decades prove successful, adaptation measures will still be necessary to deal with the unavoidable impacts of climate change.
Broadly speaking, 'adaptation' refers to measures that aim to adjust natural or human systems to actual or expected climate change or its effects in order to moderate harm or exploit potential benefits (IPCC, 2007). This includes various approaches that ensure ecosystem resilience and adaptive capacity in general, and comprises technological solutions ('grey' measures), ecosystem-based adaptation options ('green' measures), and behavioural, managerial and policy approaches ('soft' measures) (EEA, 2010).
Reducing greenhouse gas emissions is essential for achieving a low-carbon economy
Preventing (and adapting to) adverse climate change is one the greatest challenges of our time, and closely interlinked with a range of other environmental and societal challenges (EEA, 2010). Achieving a low-carbon economy is a therefore a critical element in a transformation towards a green economy. Succeeding in substantially reducing greenhouse gas emissions — while avoiding adverse economic effects so far as possible — is at the core of efforts to improve resource efficiency.
As noted above, the 2 °C target guides today's international climate policy. It is now recognised that meeting this target will require substantial reductions in global greenhouse gas emissions: under the Copenhagen Accord countries agreed 'that deep cuts in global emissions are required' (UNFCCC, 2009). In the long run, this is likely to require emission cuts of around 50 % compared to 1990 levels by 2050 globally (IPCC, 2007).
The European Union has already committed to reduce emissions by (at least) 20 % from 1990 levels by 2020. It also has the 'objective of reducing greenhouse gas emissions by 80 to 95 % by 2050 compared to 1990 in the context of necessary reductions […] by developed countries as a group' (EC, 2011a). Achieving this will be an important contribution to international climate mitigation efforts, although meeting the 2 °C target will also require similar substantial emission cuts globally.
The European Union has achieved significant reductions in greenhouse gas emissions over recent decades. Domestic greenhouse gas emissions were reduced by over 15 % between 1990 and 2010 (EEA, 2011b) (Figure 5.3). Relative to economic development (measured as GDP growth) this decline is even greater: emissions per unit of EU GDP decreased by more than a third (EEA, 2011b). Also, annual emissions per capita have decreased but remain relatively high at an estimated 9.4 t CO2-eq per person in 2010 (EEA, 2011b).
Figure 5.3 Domestic GHG emissions in the EU-15 (*) and the EU-27, 1990–2010
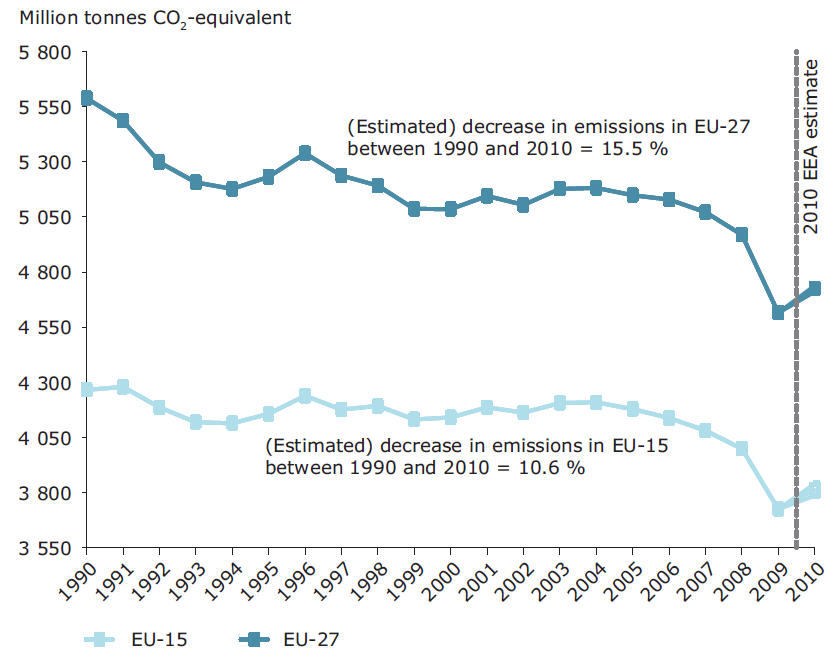
Note: (*) EU-15 comprises Austria, Belgium, Denmark, Finland, France, Germany, Greece, Ireland, Italy, Luxembourg, the Netherlands, Portugal, Spain, Sweden, the United Kingdom. Numbers for 2010 are estimates, see EEA (2011b).
Source: CSI 10 indicator and EEA (2011b).
These reductions have primarily resulted from improvements in energy and fuel efficiency, a shift from coal to less polluting fuels, increases in renewable energy, better waste management and, to a substantial part, the economic restructuring in eastern Member States in the early 1990s. Significant improvement in energy efficiency has occurred in all economic sectors, due to technological developments in, for example, industrial processes, car engines, space heating and electrical appliances (EEA, 2010).
To reach the long-term climate targets, further improvements in energy savings and energy efficiency will be needed, as well as systemic changes in the way we generate and use energy and in the way we ensure mobility and transport (EEA, 2010).
The energy sector plays a key role in facilitating a move to a low-carbon economy
The current fossil fuel-based energy and transport systems, which emit large amounts of greenhouse gases, are at the root of climate change. Globally, energy supply accounts for some 25 % of greenhouse gas emissions; in the European Union the figure is even higher at a little more than 30 % of total greenhouse gas emissions. Emissions from energy production have reduced significantly in Europe since 1990 (more than 17 %), in part due to an increase in the share of renewable energy sources (EEA, 2011b).
The Europe 2020 strategy for smart, sustainable and inclusive growth (EC, 2010) explicitly links a triplet of interconnected headline targets to be accomplished by 2020: reducing greenhouse gas emissions by 20 % (or more, depending on international negotiations) relative to 1990; increasing the share of renewables in the EU's energy mix to 20 %; and increasing energy efficiency by 20 % by 2020.
Promisingly, the share of renewable energy sources in gross inland energy consumption (i.e. the total energy demand of a country or region) nearly doubled in the European Union over the past two decades: from about 4 % in 1990 to about 9 % in 2009 (CSI 30). The share of renewable electricity in gross electricity consumption saw a similar increase over this period: from about 12 % in 1990 to almost 20 % in 2009 (CSI 31).
Meanwhile, the share of renewable energy in final energy consumption (i.e. the total energy consumed by end users, excluding what is used by the energy sector, taking into account also losses that occur during transmission and distribution of energy) increased from under 7 % in 1998 to almost 12 % in 2009 (ENER-28). This represents a significant effort but also highlights the need for further efforts to meet the legally binding 20 % target for the share of renewables by 2020 for the European Union as a whole.
The main renewable energy sources are biomass and waste (accounting for 70 % of total renewable energy), followed by hydro (19 %) and wind (nearly 7 %). The share of solar remains relatively small (1.1 %). The annual growth rates for the combined use of renewable energy sources have increased over recent years (ENER-29): between 2005 and 2009, the annual average growth rate for all renewables was about 7 %. Wind energy and solar photovoltaic showed particularly high growth rates of 17 % and 76 %, respectively (CSI 30) (Figure 5.4).
Figure 5.4 Average annual growth rates of renewable energy in EU-27 electricity consumption, 1990–2009 and 2005–2009
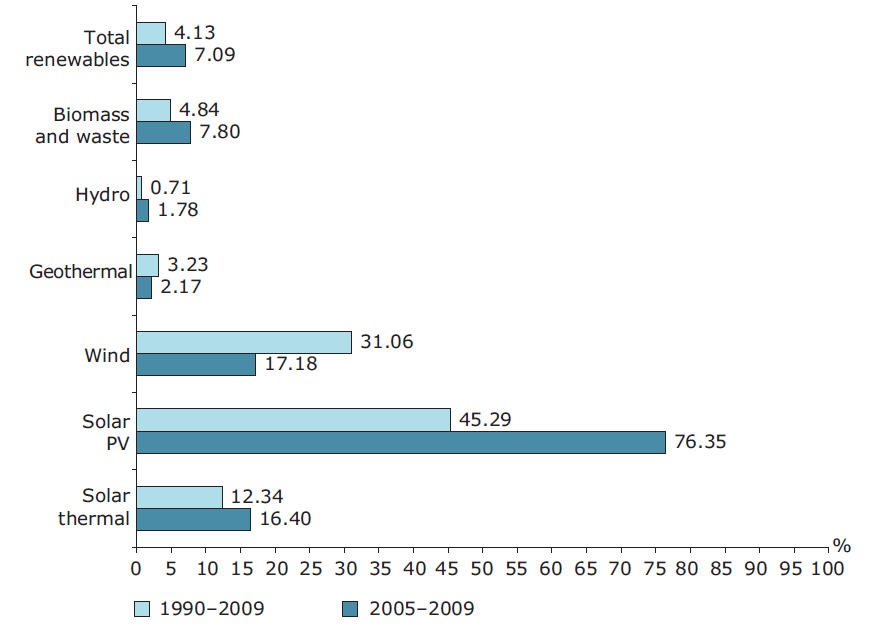
Source: ENER-29 indicator, based on Eurostat data.
Meanwhile, as regards energy efficiency, substantial steps have been taken towards increasing energy savings in primary energy by 20 %, compared to projections (11) (EC, 2007). Nevertheless, estimates that take into account energy efficiency measures implemented up to 2009 suggest that the European Union is on course to achieve only half of the 20 % objective (EC, 2011b). Further efforts are thus under discussion and a new directive on energy efficiency is currently being negotiated.
Renewable energy and energy efficiency are major economic opportunities. Many mechanisms for improving energy efficiency pay for themselves, and investments in renewable energy technologies are becoming increasingly competitive, particularly when the full environmental and societal costs of fossil fuel are taken into account. From 2002 until mid-2009, total investments in renewable energies grew at a compound annual rate of 33 % globally (UNEP, 2011).
In the long run, it is generally considered that meeting the 2 °C target will require more than incremental emission reductions and increases in renewables and energy efficiency. Systemic changes in the way we generate and use energy, and how we produce energy-intensive goods are also likely to be required (EEA, 2010).
Box 5.1 The EU emissions trading system
The EU emissions trading system (EU ETS) is one of the EU's key climate policy instruments. The EU ETS is based on the cap-and-trade principle, meaning that there is a cap on the amount of greenhouse gases that can be emitted by economic actors participating in the system, and that individual participants can trade their emission allowances.
The EU ETS is implemented in the 27 EU Member States plus Iceland, Liechtenstein and Norway, covering more than 11 000 power stations and industrial plants. Introduced in 2005 as the key instrument to reduce industrial greenhouse gas emissions cost-effectively, the scheme was revised and will be different when Phase III starts in 2013.
One of the main changes is that auctioning of emission allowances will become the rule instead of free allocation as was done during the first two periods. The number of emission allowances will be cut annually during Phase III, which will run from 2013 until 2020, reducing the number of allowances to 21 % below the 2005 level in 2020. This will make a major contribution to achieving the EU's 20-20-20 targets, specifically the goal of reducing EU greenhouse gas emissions to at least 20 % below 1990 levels in 2020. The scope of the EU ETS will also be extended in Phase III as more economic sectors and greenhouse gases are included.
6. Air pollution and air quality
Clean air is vital to our well-being. Economic activities — in particular those related to road transport, power and heat production, industry and agriculture — emit a range of air pollutants. These have direct and indirect effects on human health, and adversely affect both ecosystems and cultural heritage.
This chapter primarily focuses on the following EEA indicators: 'Exceedance of air quality limit values in urban areas' (CSI 04) as a proxy for ecosystem resilience; and 'Emission of ozone precursors' (CSI 02) and 'Emission of primary particulate matter and secondary particulate matter precursors' (CSI 03) as proxies for resource efficiency. In addition, indicators on 'Passenger transport demand' (CSI 35) and 'Freight transport demand' (CSI 36) illustrate decoupling trends in the transport sector.
The 'Exceedance of air quality limit values' indicator used here describes potential human exposure to high levels of air pollutants in an urban environment only. It can thus serve only as a rather approximate indicator for stresses on human health. Nevertheless, this indicator does offer some insight into whether we are achieving levels of air quality that ensure a degree of resilience and do not cause significant harm to health.
Similarly, indicators on total emissions of ozone and particulate matter precursors illustrate only one aspect of resource efficiency, namely whether we are successful in reducing environmental pressures. To relate these pressures directly to economic activities it would be necessary to disaggregate the data by sector to enable comparisons with economic development in each sector. This is not done here.
Other related EEA indicators and reports include (see Annex):
• Indicators and indicator sets: air pollution (APE), energy (ENER), and transport (TERM)
• Air quality in Europe — 2011 report (EEA, 2011a)
• Laying the foundations for greener transport — TERM (EEA, 2011b)
Air pollution and air quality
Economic activities — in particular those related to road transport, power and heat production, industry and agriculture — emit a range of air pollutants. Air pollutants have direct and indirect effects on human health, and they adversely affect both ecosystems and cultural heritage via acidification, eutrophication and exposure to ozone (Figure 6.1).
Five groups of air pollutants directly emitted to the air have been particular priorities in Europe during recent decades: sulphur dioxide (SO2), nitrogen oxides (NOX), ammonia (NH3), non-methane volatile organic compounds (NMVOC) and primary particulate matter (PM).
Sulphur and nitrogen compounds (i.e. SO2, NOX, NH3) emitted into the air are potentially acidifying and can cause harm when deposited into sensitive terrestrial or aquatic ecosystems. The main source of SO2 and NOX emissions to the air is the combustion of fossil fuels, via heat and power generation and road transport. In addition, nitrogen compounds can also cause eutrophication. The main sources of NH3 emissions are agricultural activities (see Chapter 3).
Meanwhile, particulate matter (PM), ozone (O3) and nitrogen dioxide (NO2) are broadly considered to be Europe's most problematic atmospheric pollutants in terms of harm to human health. In particular, both high PM and O3 pollution have been linked to reducing life expectancy and to cardiovascular and chronic respiratory effects.
PM in the atmosphere can result from direct emissions (primary PM) or the transformation of PM precursor substances emitted to the atmosphere (secondary PM). Such substances include nitrogen oxides, sulphur dioxide, ammonia, as well as other inorganic and organic compounds. Key sources of direct PM emissions include the residential sector (mainly burning solid fuels such as coal and wood), road transport and public electricity and heat production.
Ozone is formed in the atmosphere by reactions between NOX, volatile organic compounds (VOC, including methane) and carbon monoxide (CO) gases in the presence of sunlight and heat. Ozone pollution is thus a major concern during the summer months. Road and off-road transport, industrial activities and use of solvents are the major sources of ozone precursors.
Figure 6.1 Major air pollutants in Europe, clustered according to impacts on human health, ecosystems and the climate
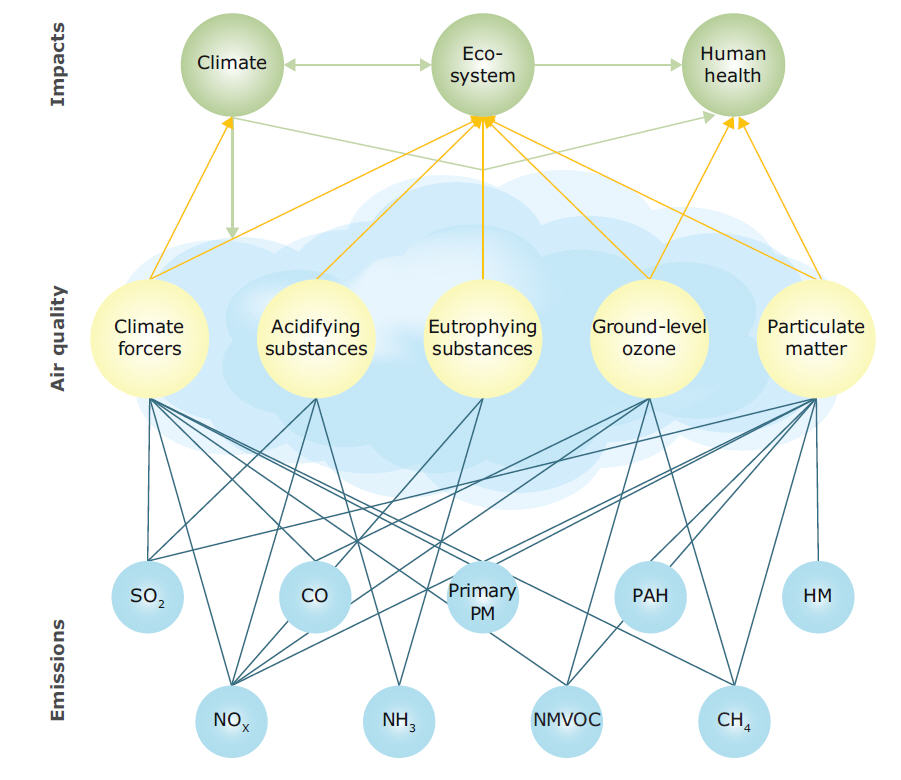
Note: From left to right the pollutants shown as follows: sulphur dioxide (SO2), nitrogen oxides (NOX), carbon monoxide (CO), ammonia (NH3), particulate matter (PM), non-methane volatile organic compounds (NMVOC), polycyclic aromatic hydrocarbons (PAH), methane (CH4), heavy metals (HM).
Source: EEA, 2011a.
Achieving levels of air quality that secure a safe and resilient living environment
After being emitted from transport, energy production, agriculture or other sources, air pollutants are subject to a range of processes in the atmosphere, such as atmospheric transport, mixing and chemical transformation. Air pollution in Europe is of local, regional and even hemispheric concern, as changes in air quality may occur close to emission sources, or much further away, or both, depending on the atmospheric transport.
Resulting changes in air quality may lead to various negative impacts, including effects on human health caused by exposure to air pollutants or intake of pollutants transported through the air, deposited and accumulated in the food chain. Similarly air pollution can cause acidification of ecosystems, both terrestrial and aquatic, leading to loss of flora and fauna, as well as eutrophication in ecosystems on land and in water, which can lead to changes in species diversity (see, for example, Chapter 4).
Other negative impacts, not addressed here, include damage and yield losses affecting agricultural crops, forests and other plants due to exposure to ground-level ozone; impacts of heavy metals and persistent organic pollutants on ecosystems, due to their environmental toxicity and bioaccumulation; effects on climate forcing; and damage to materials and cultural heritage due to soiling and exposure to acidifying pollutants and ozone.
In combination, emissions of air pollutants impact environmental resilience and alter the availability of clean air for both ecosystems and human health.
Box 6.1 Particulate matter and air quality targets
EU air quality limit and target values for PM10 and PM2.5 (for the attainment years 2005 and 2010, respectively) as given in the Air Quality Directive (2008/50/EC) are as follows:
Annual mean: for PM2.5: 25 μg/m3 for PM10: 40 μg/m3
24-hour mean: for PM2.5: n.a. for PM10: 50 μg/m3
(not to be execeeded on more than 35 days/year)
The WHO air quality guidelines are as follows:
Annual mean: for PM2.5: 10 μg/m3 for PM10: 20 μg/m3
24-hour mean: for PM2.5: 25 μg/m3 for PM10: 50 μg/m3
Source: EEA, 2011a.
Epidemiological studies attribute the most severe health effects from air pollution to PM and, to a lesser extent, ozone. PM inhaled by humans can shorten life expectancy and increase the number of premature deaths, hospital admissions and emergency room visits (e.g. respiratory diseases, increased risk of heart attack). Ozone can cause breathing problems, trigger asthma, reduce lung function and cause lung diseases. For both pollutants, no safe level has been identified as even at concentrations below current EU air quality standards and WHO guidelines pose a health risk.
The EU limit and target values for PM were exceeded widely in Europe in 2009. The World Health Organization (WHO) guidelines for PM10 and PM2.5 annual mean concentrations were likewise exceeded at a large number of monitoring stations across continental Europe, although to a lesser extent in the Nordic countries. Despite emission reductions, 18–49 % of the EU urban population was exposed to ambient air concentrations of PM10 in excess of the EU air quality daily limit value in the period 1997–2009 and there was no discernible downward trend. Between 21 and 50 % of the urban population in EEA-32 countries was exposed in this period (EEA, 2011a) (Figures 6.2 and 6.3).
Figure 6.2 Percentage of the EU urban population potentially exposed to air pollution exceeding EU air quality standards, 1997 to 2009
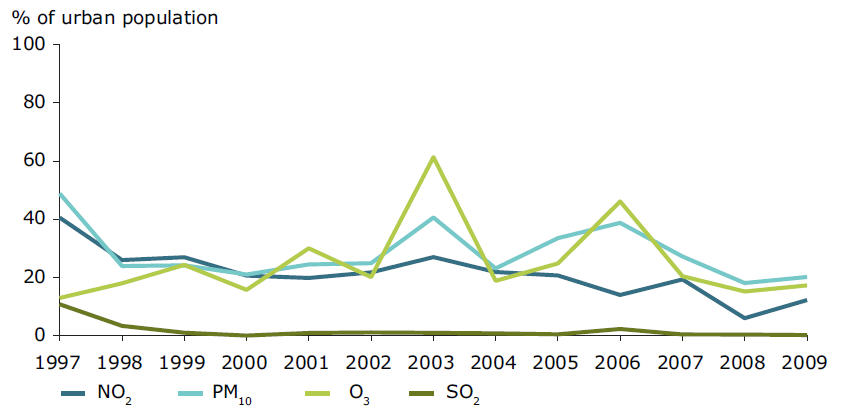
Note: Since O3 and the majority of PM10 are formed in the atmosphere, meteorological conditions have a decisive influence on airborne concentrations. This at least partly explains the interannual variations.
Source: CSI 04 indicator.
Figure 6.3 Percentage of the population resident in EU urban areas potentially exposed to PM10 concentration levels exceeding the daily limit value, 1997 to 2009
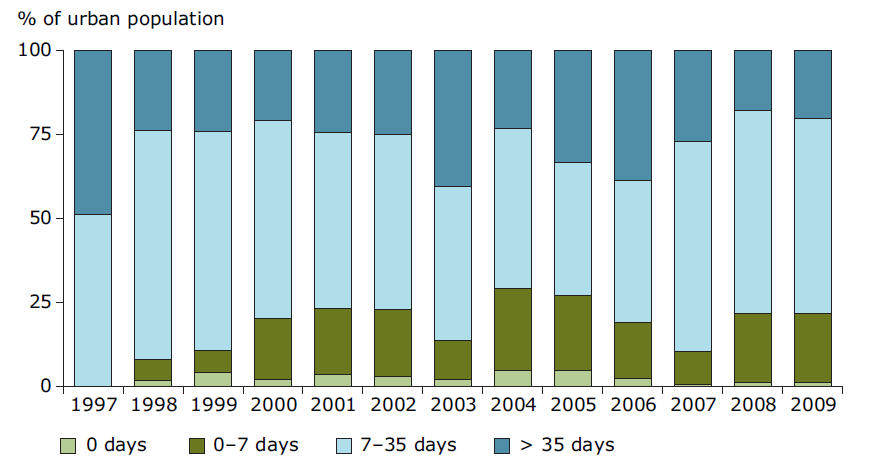
Source: CSI 04 indicator.
Similarly, 17 % of the European urban population lives in areas where the EU ozone target value for protecting human health (12) was exceeded in 2009. In the period 1997–2009, this figure ranged between 13 % and 61 %. High ground-level ozone concentrations are most pronounced in southern Europe (EEA, 2011a).
In order to reach long-term air quality objectives, with ozone levels that avoid significant negative effects on human health and the environment, substantial emission reductions of both NOX and VOCs are needed at the local, regional and hemispheric levels. Moreover, further substantial emission reductions of primary particulate matter and PM precursors such as NH3, NOX, and SO2 are needed to bring down current PM levels.
Using atmospheric resources more efficiently by reducing air pollution
As noted, clean air is an essential resource vital to our well-being. Air pollution reduces the availability of clean air; and the higher and more dangerous the pollutants in the air are, the more this resource is under pressure. Pollutant emissions to the air therefore constitute a particular pressure on a natural resource. Thus, resource efficiency is increased, and pressure on atmospheric resources decreased, by reducing the emissions from economic activities.
When explaining trends in air quality as expressed in PM concentrations in air, emission trends in both primary PM and precursor gases must be considered. In addition to emissions, meteorology plays an important role. A certain fraction of emitted precursor gases form particles in the air, depending on atmospheric conditions (temperature, sunlight, humidity, reaction rate). As dispersion and atmospheric conditions differ from year to year, the trend includes a high year-to-year variability.
Emissions of primary PM, i.e. emitted directly into the air, fell in the EU between 1999 and 2009, by 16 % for PM10 and 21 % for PM2.5. The reductions in the longer period of 1990 to 2009 were higher at 27 % for PM10 and 34 % for PM2.5. At the same time, emissions of the precursor gases SOX and NOX declined even more, by 80 % and 44 % respectively in the period 1990–2009 (EEA, 2011a) (Figure 6.4).
European policies have significantly contributed to this reduction of PM precursor gas emissions. For NOX emissions, for example, it has been estimated that European policies in the period 1990–2005 (13) were responsible for reducing emissions from road vehicles by more than half and from industrial plants by more than two-thirds. The policy-induced reduction in SOX emissions from industrial plants have been estimated to be of similar scale (EEA, 2011a).
Figure 6.4 EU emissions of primary PM and of PM and ozone precursor gases not including carbon monoxide, 1990–2009
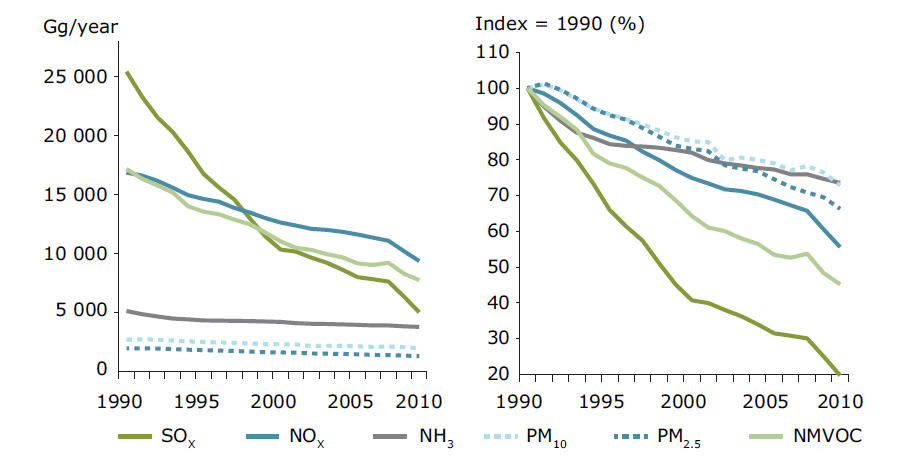
Source: CSI 02 and CSI 03 indicators, EEA, 2011.
EU emissions of the air pollutants primarily responsible for forming harmful ground-level ozone also fell significantly in the period 1990–2009. CO emissions were cut by 62 %, NMVOC by 55 % and NOX by 44 %. Nevertheless, in 2009 NOX emissions remained 12 % above the National Emissions Ceilings Directive (2001/81/EC) limit to be attained by 2010, mainly due to road transport emissions (EEA, 2011a).
Transport and energy are the main sectors responsible for emissions of NOX, followed by industry. The transport sector reduced its NOX emissions by 39 % between 1990 and 2009 and the energy and industry sectors by 51 % and 40 %, respectively. In addition, several sectors have significantly cut their NMVOC emissions in the last two decades. The transport sector, which was the largest emitter in the 1990s, secured the greatest reduction with a 77 % cut in the period 1990–2009 (EEA, 2011a).
The transport sector offers scope to reduce air pollution further in a green economy
Despite reductions in PM emissions from both the transport and energy sectors, the most important anthropogenic source of PM remains fuel combustion. This includes thermal power generation, incineration, household use for domestic heating, and vehicles. Particularly in cities, vehicle exhaust, road dust re-suspension and burning of wood, fuel or coal for domestic heating are important local sources.
For road transport, the introduction of reduced sulphur fuels and catalytic converters on vehicles (the latter driven by introduction of the successive Euro standards that regulate exhaust emissions of CO, NOX, NMVOC and primary PM) have contributed substantially to overall reductions of PM emissions. For PM alone, the Euro 4 emission factors (in force since 2005) are 69 % lower than the Euro 2 emission factors (from 1996) for light-duty (passenger) vehicles and 92 % lower for heavy-duty diesel vehicles (EEA, 2011a and 2011b).
This decrease in emissions per vehicle has been partly offset by an increase in road traffic in the same period. Despite a dip in demand in recent years, the overall trend is that passenger road transport (measured in person kilometres) continues to grow. On average, the increase in passenger road transport has been slower than GDP growth due to congestion, low population growth and saturation of car ownership in some Member States (ISIS, 2010). Data show, however, that passenger road transport actually increased relative to GDP in 2009 — resulting in 'negative decoupling' of over 4 % (Figure 6.5). This may be because lower household incomes tend to reduce demand for longer trips but do not affect less fuel-efficient local trips as much (EEA, 2011b).
Figure 6.5 Trends in passenger transport demand (pkm = person kilometres) and GDP
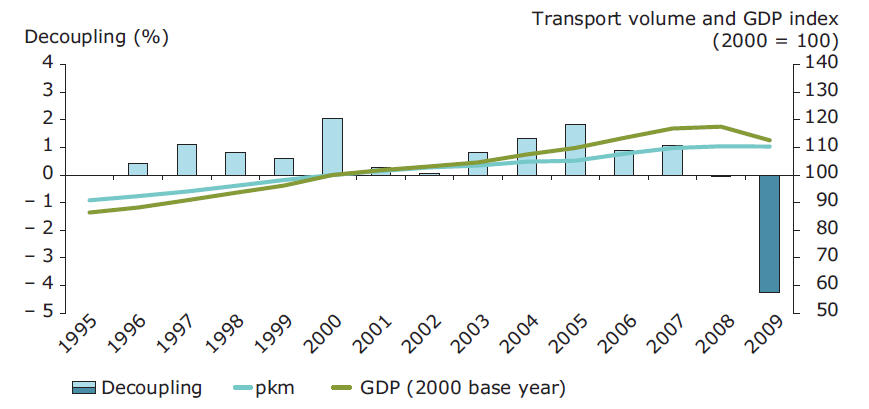
Note: The two curves show the development in GDP and passenger transport volumes, while the columns show the level of annual decoupling. Light green indicates greater growth in GDP than in transport while dark green indicates stronger growth in transport than in GDP. The data refer to road, rail and bus modes of transport.
Source: CSI 35 indicator.
Figure 6.6 Trends in freight transport volume (tkm = tonne kilometres) and GDP
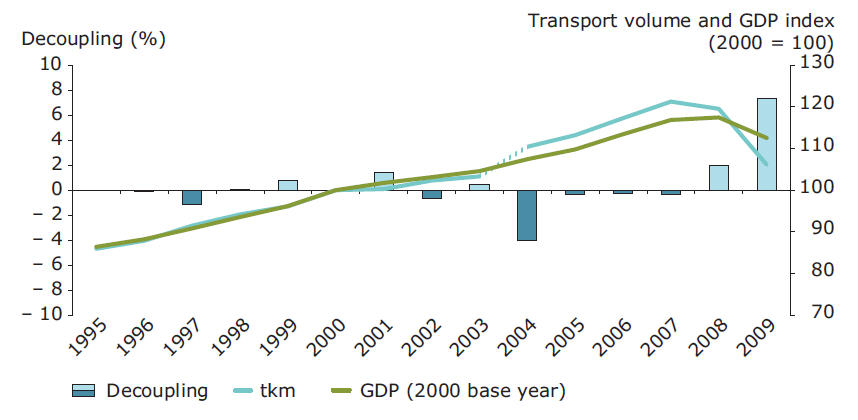
Note: The two curves show the development in GDP and freight transport volumes, while the columns show the level of annual decoupling. Light green indicates faster growth in GDP than in freight transport while dark green indicates stronger growth in freight transport than in GDP. The data refer to road, rail and bus modes of transport. The large change in 2004 is tied to a change in methodology, but no correction figure exists.
Source: CSI 36 indicator.
Freight transport demand in terms of tonnes and km has dropped dramatically in recent years, in contrast to the previous decade of growth. Between 2008 and 2009, totals transported by road, rail and inland waterways fell by 11 % to a level not seen since mid-2003. Total GDP in the EEA-32 fell to a lesser extent, declining 4 % between 2008 and 2009. In contrast to the situation with passenger road transport, freight transport decoupled from GDP by more than 7 % in 2009 (Figure 6.6). It is likely that this recent decoupling is a temporary result of the economic recession (EEA, 2011b). There is evidence, however, that decoupling could arise due to changes in GDP composition towards the service sector, shifts to demand for more expensive lighter goods (e.g. finished products), and offshoring of industrial capacity (IEA, 2009).
Policies for greening transport follow three interlinked principles:
• optimising transport demand, i.e. avoiding or reducing trips through integration of land use and transportation planning, and localised production and consumption;
• obtaining a more suitable modal split — shifting to more environmentally efficient modes such as public and non-motorised transport for passengers, and to rail and water transport for freight;
• using the best available technology, i.e. improving vehicle and fuel technology to reduce the negative social and environmental effects from each kilometre travelled (EEA, 2011a; UNEP, 2011)
Studies indicate that the environmental and social costs of local air pollutants, traffic accidents and congestion, can be far in excess of the amounts required to jump start a transition to a green economy (UNEP, 2011).
Box 6.1 Road traffic congestion charges
During recent years several EU Member States have implemented road pricing schemes. The objectives of the different schemes can be numerous, including revenue generation, managing demand to solve congestion problems, and environmental considerations (i.e. minimising the environmental impacts from traffic and internalising the external costs of traffic). The choice of policy measures includes congestion charges, parking fees, and tolls for using specific roads, tunnels and bridges.
In June 2011 the EU adopted a revised Eurovignette Directive (2011/76/EU). Under the new rules, EU Member States will be able to set charges covering not only infrastructure costs — as was the case under the 1999 Eurovignette Directive (1999/62/EC) — but also the costs for noise and air pollution caused by lorries. The revised Directive foresees that 15 % of the toll revenues will be earmarked for TEN-T (trans-European transport network) projects.
Alongside these financial instruments, regulatory policies are becoming more apparent, linking road demand management and environmental impacts. An example is the use of so-called 'Umweltplakette' (environmental or emission badges) in Germany, restricting entry into environmental (or low emission) zones that are threatened by particulate matter (such as PM10). Particulate matter is one of the major air pollutants aggravating conditions such as lung diseases and asthma, and traffic is a major source of particulate matter in cities.
Entry into these environmental zones is regulated on the basis of European vehicle emission standards. The standards establish requirements defining the acceptable limits for exhaust emissions from vehicles in EU Member States. Petrol cars with catalytic converters belong to the Euro 4 standard and are entitled to enter environmental zones. Vehicles belonging to Euro 2 or Euro 3 standard are forbidden in inner zones of some cities, such as Berlin, Leipzig and Munich.
7. Maritime activities and the marine environment
European industries operating in the marine environment make an important contribution to the European economy. Tourism and fishing activities are part of the social fabric in many regions. When pressures from maritime activities are combined with those from land-based activities, such as eutrophication and pollution, ecosystem resilience thresholds can be exceeded, resulting in substantial environmental and economic losses.
This chapter focuses on the following indicators: 'Habitats and species of European interest' (SEBI 03 and SEBI 05) and marine 'Sites designated under the EU Habitats and Birds Directive' (SEBI 08) as proxies for ecosystem resilience; and the maritime 'Energy efficiency and specific CO2 emissions' (TERM 27) as a proxy for resource efficiency. Information on 'Fish catches and consumption' (based on FAO data) and 'Aquaculture production' (CSI 33) illustrate the potential for a green economy.
Where indicators describing habitats and species show an unfavourable conservation status, the resilience of sensitive marine and coastal ecosystems may be under threat. Conversely, information about marine protected areas, which aim to conserve some of Europe's most valuable and threatened species and habitats, can illustrate progress in putting in place measures to ensure ecosystem resilience.
No single indicator reflects the various resource uses and efficiencies of the different maritime activities. Carbon dioxide emissions per tonne-kilometre (of freight transported) do, however, illustrate one component of resource efficiency. That is, whether one environmental pressure from this activity is decreasing. Emissions could also be related to the sector's economic development but this is not considered here.
Other related EEA indicators and reports include (see Annex):
• Indicators and indicator sets: fisheries (CSI 32, CSI 33, CSI 34)
• SOER 2010: marine and coastal environment (EEA, 2010a)
• 10 messages for 2010 — coastal ecosystems (EEA, 2010b)
• 10 messages for 2010 — marine ecosystems (EEA, 2010c)
Maritime activities and the marine environment
The marine area under the jurisdiction of EU Member States is substantial — larger than the total land area of the EU — and supports European industries such as shipping, fishing, offshore wind energy, tourism, and oil, gas and mineral extraction (EEA, 2010a). Combined, these sectors play an important role in national and European economies and supply goods and services that support European citizens and their ways of life.
Figure 7.1 Simplified illustration of maritime uses and pressures on the marine and coastal environment
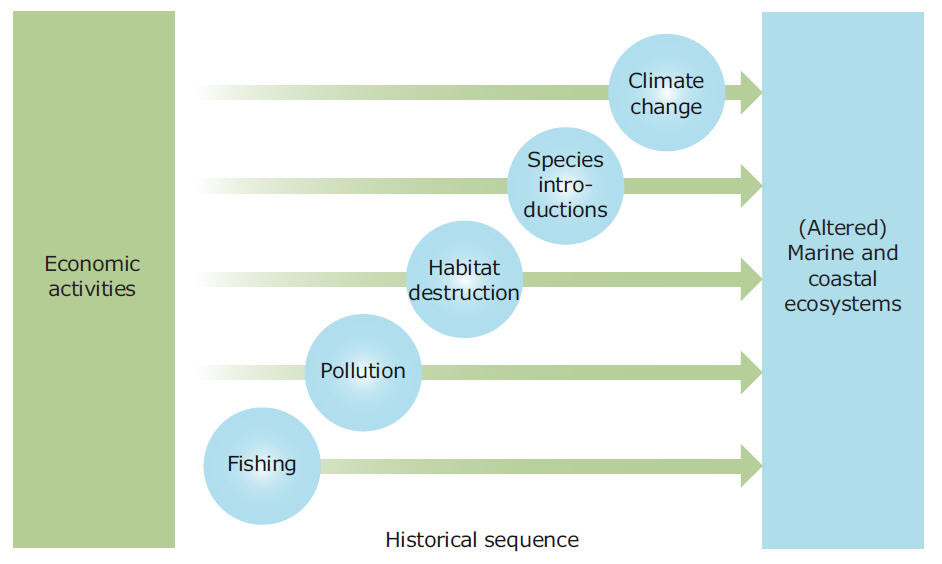
Note: The five pressures identified in Figure 7.1 correspond to some degree with 'Human activities and uses' listed in Table A1.3 of the Marine Strategy Framework Directive reporting process (EC, 2011a), which includes: Extraction of living resources (e.g. fisheries), food production (e.g. aquaculture), man-made structures (e.g. port operations), extraction of non-living resources (e.g. mining), energy production (e.g. wind, wave and tidal power), transport (e.g. shipping), waste disposal (e.g. solid waste disposal and storage of gases), tourism and recreation (e.g. yachting, bathing, diving), research and survey (e.g. educational activities), military (e.g. dumping of unwanted munitions) and land-based activities/industries (e.g. agricultural, industrial and wastewater discharge and emissions). Other than for fishing, which was found to preceed other human disturbances in all cases examined, the historical sequence may vary.
Source: Adapted from Jackson et al., 2001.
Impacts from these and other human activities can interact and lead to the disruption of habitat or food web functioning, with amplified and cascading effects within marine ecosystems (Figure 7.1). In European seas there are infinite unique ways in which the marine food web functions — and a seemingly small change can have a large impact (EEA, 2010a).
There are many examples of human actions that have inadvertently had catastrophic consequences. In several European seas multiple impacts have shifted the balance of an entire ecosystem. When pressures from maritime sectors are combined with those from land-based activities, such as eutrophication and pollution, ecosystem resilience thresholds can be exceeded, resulting in substantial environmental and economic losses. This has been witnessed in the Black and Baltic Seas, and risks occurring in the North and Arctic Seas. These collapses in ecosystem function have occurred as a result of several pressures acting simultaneously (EEA, 2010a).
In response, European policies governing the coastal and marine environment now widely use an ecosystem-based approach — a strategy for integrated management of living resources and land-based and marine activities, which promotes conservation and sustainable use, and addresses the combined effects of multiple pressures (EEA, 2010a).
Managing the marine environment using more resilient, ecosystem-based approaches
The marine environment under EU jurisdiction is governed by instruments including the Integrated Maritime Policy and its environmental pillar, the Marine Strategy Framework Directive (2008/56/EC) (MSFD). Their fundamental objective is to protect and preserve the marine environment by achieving good environmental status in Europe's seas by 2020 (EEA, 2010a).
This will require actions to protect the structure and function of marine ecosystems, including but not limited to maintaining biological diversity, food web integrity and the quality, distribution and abundance of marine habitats (EEA, 2010a).
Available information indicates, however, that biodiversity loss in all European seas and coasts is considerable and shows little sign of declining (EEA, 2010d). Just 8 % of coastal habitats and 10 % of marine habitats that have been assessed have a favourable conservation status (EEA, 2010a). In fact, many marine and coastal species and habitats have an unfavourable conservation status, meaning that they are at serious risk of extinction (at least locally) or require significant alteration to their management (Figure 7.2) (see also Chapter 4).
Designating protected areas is an essential measure to conserve biodiversity and protect habitats in Europe's marine environment, and the MSFD specifies that this is a means to achieve good environmental status. 'Natura 2000' protected sites, established under the EU Habitats and Birds Directives (92/43/EEC and 2009/147/EC), aim to ensure the long-term survival of Europe's most valuable and threatened species and habitats. They include protected areas where the emphasis is on ensuring that future management of the site is sustainable, both ecologically and economically. Member States are responsible for determining the most appropriate methods and instruments for achieving the conservation objectives of Natura 2000 sites.
In recent years, protection of marine areas in the EU has gained momentum. By September 2011 more than 3 300 sites, either fully or partly marine, had been classified as Natura 2000 sites (Map 7.1). These sites cover an area of approximately 213 000 km2, mostly in near-shore areas and in the Baltic Sea. While significant, this represents just 4 % (approximately) of EU waters and lags seriously behind the designation of protected areas in the terrestrial environment. In addition, a coherent network of offshore areas is noticeably absent. Achieving greater protection has been problematic due to delays in identifying areas and assessing their status (EC, 2009a) and the added complexity of international collaboration required for effective protection of marine areas (EEA, 2010a and 2010d).
The ecosystem-based approach now being applied to managing the EU marine environment aims to balance the many demands upon it and to realise synergies between the marine and maritime policy framework. The aim is to achieve good environmental status (EEA, 2010d), with associated benefits for the long-term resilience of the marine environment.
Box 7.1 Marine protected areas and species abundance
Studies show that establishing protected areas may help increase the abundance and biomass of individual organisms, raise the proportion of larger and older individuals, enhance the fisheries yield outside the protected area and increase the dominance of large predator species (Garcia-Charton et al., 2008). It has also been shown that the extent of recovery increases with the age and size of the protected area (Claudet et al., 2008; EEA, 2010d).
Figure 7.2 Conservation status of coastal (left) and marine (right) habitat types of European interest
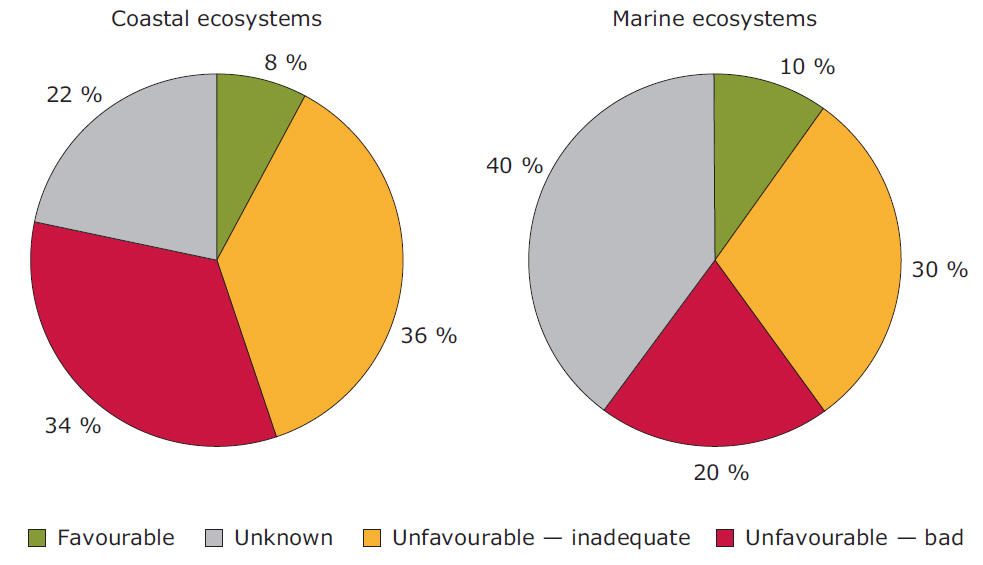
Source: Adapted from the SEBI 05 indicator. See also EEA (2010e).
Map 7.1 In-shore and off-shore Natura 2000 sites, 2011
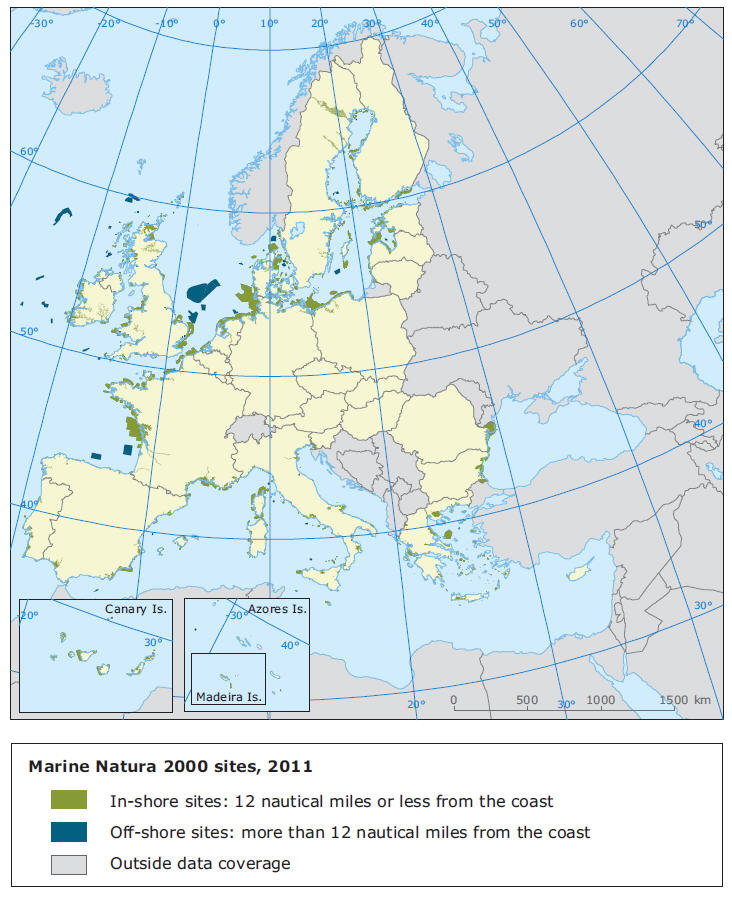
Source: Adapted from SEBI 08 indicator.
Improving resource efficiency in maritime sectors: shipping
Shipping is one of the key maritime activities in EU waters, enabling trade and contacts between European nations, ensuring supplies of energy, food and commodities, and representing the primary vehicle for European imports and exports to the rest of the world. Almost 90 % of EU external freight trade is seaborne and every year shipping facilitates the transport of 2 billion tonnes of cargo and 1 billion tonnes of oil through EU waters and ports (EC, 2011b).
The substantial and wide-ranging activities of this sector have impacts on the sensitive marine environment in which it operates. Such impacts include the establishment and spread of invasive species, oil spills and emissions of CO2 (among other air pollutants), which contribute to climate change. These impacts add to those from other marine sectors and land-based activities, with implications for marine ecosystem resilience. Climate change, for example, is already affecting marine ecosystems, due to reduced Arctic Sea ice coverage, sea-level rise, increasing ocean acidification, and raised water temperatures, which are changing the composition of plankton and some fish species (EEA, 2010a). Further changes to marine biological, chemical and physical processes are anticipated as a result of climate change, and are likely to reduce ecosystem resilience further (EC, 2012).
As a whole, transport (on land and sea) accounts for almost a quarter of total EU CO2 emissions. Energy efficiency improvements across the associated sectors can therefore result in considerable cuts in energy consumption and CO2 emissions (TERM 27).
In terms of all freight transport volumes, sea shipping accounts for a significant part of the total (when international sea transport is included). However, due to methodological and data reliability problems, sea transport is frequently omitted from transport statistics. Data is available for the EU-27 and it shows that the demand for intra-European short-sea transport is roughly equivalent in volume to the level of road transport (which has the largest share of all transport modes when international sea transport is not included) (CSI 36) (Figure 7.3).
Figure 7.3 Total and sea freight transport demand in billion tonne-kilometres, EU-27, 1995 to 2009
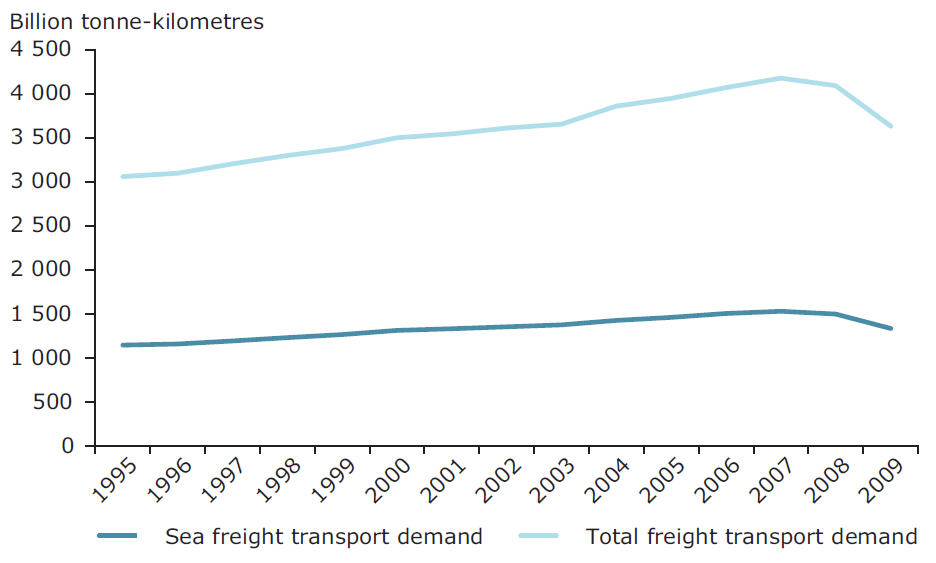
Source: CSI 36 indicator.
Figure 7.4 Modelled CO2 emissions as tonne/km for freight transport, 2000 and 2010
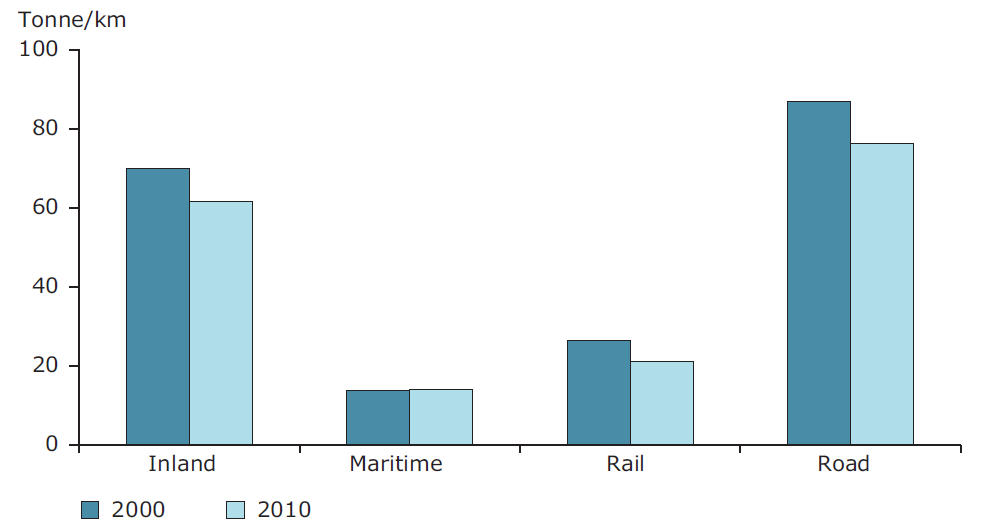
Source: TERM 27 indicator.
Maritime shipping is the most energy efficient means of freight transport. For example, it is currently around 1.5 times more efficient than rail and around 5.5 times more efficient than road freight transport (Figure 7.4). Between 1995 and 2009, however, the energy efficiency of this sector has not improved greatly, recording a modest 4 % increase compared to more substantial improvements in other freight transport modes. This means that CO2 emissions from the sector have grown roughly in line with increasing freight shipping activity (TERM 27).
Over recent years, the EU and its Member States have been working to improve maritime legislation and to promote high quality standards that reduce the risk of environmental pollution (EC, 2011b). In addition, the International Maritime Organization (IMO) recently adopted efficiency targets, making energy efficiency standards mandatory for all new ships. These are expected to save up to 50 million tonnes of CO2 each year by 2020 and up to 240 million tonnes of CO2 each year by 2030 from international maritime transport (IMO, 2011; EEA, 2010f). As this agreement only covers new ships and not existing ones, the European Commission is also currently working on a proposal for European action in 2012, which would see the maritime sector (including existing ships) included in its 20 % overall GHG reduction commitment (see Directive 2009/29/EC and Decision 406/2009/EC).
The fisheries and aquaculture sectors depend critically on resilient ecosystems
The fishing industry has also made efforts over recent decades to improve its efficiency and environmental performance — to ensure sustainable practices and recovery of fish stocks, and to reduce impacts on marine food webs and ecosystems. At present, however, the industry is characterised by overfishing, heavy subsidises, low economic resilience and declines in the volume of fish caught. European fisheries are eroding their own ecological and economic foundations (EC, 2009b).
Since the mid-1980s, fish abundance and catches in the EU have generally declined due to unsustainable fishing pressures (EC, 2010). This decline is particularly pronounced for demersal species, with catches falling by 100 000 tonnes per year between 1985 and 2008. In addition, more than 90 % of the fish now caught in European seas are immature, meaning species are caught before they can reproduce and restore the population (EEA, 2010). Presently, 30 % of European fish stocks for which information exists are fished outside their safe biological limits, meaning these stocks may not be able to replenish (EC, 2009b).
The marine ecosystems in Europe's waters have the potential, under substantially reformed management arrangements, to support highly productive fish stocks. Many of the fish populations currently suffering the impacts of over-fishing could increase and generate more economic output if they were exposed to less fishing pressure for only a few years (EC, 2009b). Demand continues to exceed the sustainable yield of European fisheries (EEA, 2010), and a significant proportion of the fish consumed in the European Union are supplied either through trade with other European countries (e.g. Norway) or imports from outside Europe (e.g. China, Morocco, US) (EC, 2010) (Figure 7.5).
Figure 7.5 Total fish catches, aquaculture production, consumption, imports and exports for EEA-32 countries and the western Balkans, 1995 to 2009
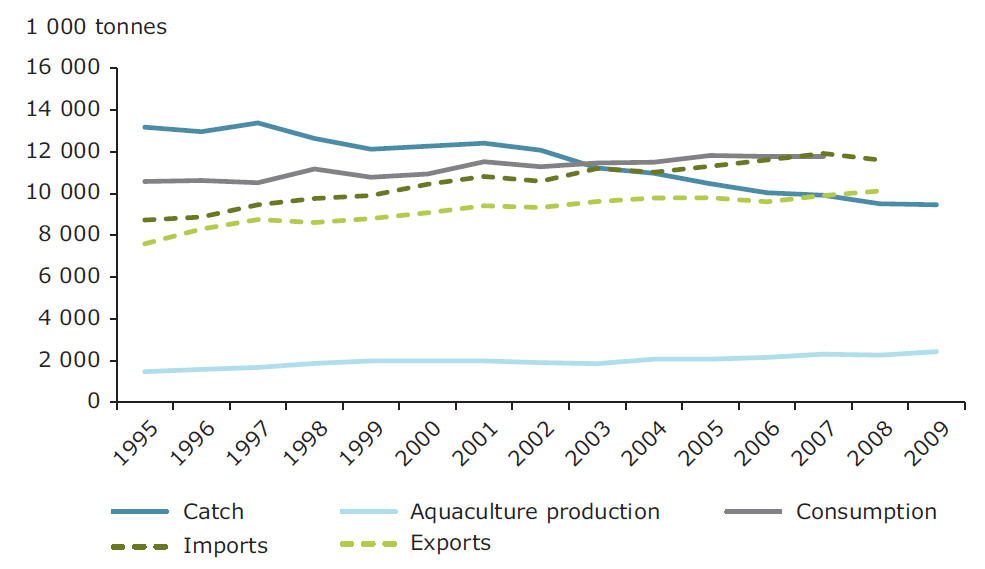
Note: Consumption here refers to human consumption only. No consumption data are available for Liechtenstein.
Source: Data from Fishstat (FAO, 2012)
To a smaller degree, marine aquaculture production within Europe also reduces pressure on fish stocks (EEA, 2010), although the extent of its role is not clear. Recent reform of the Common Fisheries Policy seeks to provide the conditions to augment EU aquaculture potential in a sustainable manner (EC, 2011c).
At the same time, aquaculture in Europe — especially finfish production (e.g. of salmonids, sea bass and sea bream) — generates other pressures on the marine environment. Major impacts include discharges of nutrients, antibiotics and fungicides. In addition, escaped farm fish provide a pathway for introduced species, and their associated parasites and pathogens, to enter the marine environment, affecting local wildlife and competing for resources. Additionally, aquaculture in some places is increasingly shifting from low to high trophic level species, which require large quantities of food based on small pelagic fish (e.g. 4 kg of small pelagic fish to raise 1 kg of salmon, and a much higher ratio for tuna). A large demand for smaller pelagic fish may further disrupt ecosystem functioning (EEA, 2010a).
Essentially, using aquaculture to meet part of European demand for seafood sees one set of impacts on the marine environment substituted with another. Likewise, importing fish caught outside of European waters transfers marine ecosystem impacts of one type and location to other sites.
The fisheries and aquaculture sectors, being heavily dependent on access to healthy marine ecosystems and biodiversity, should not be managed in isolation from each other, their broader maritime environment or other sectors operating in and sharing the same resources. The ecosystem-based approach currently being pursued under European policies governing the marine environment and maritime sectors (EEA, 2010a), aims to use marine goods and services sustainably in order to avoid further environmental deterioration or violation of the precautionary principle.
Box 7.2 Fishery subsidies
Current European financial support to the fishery sector is regulated by the European Fishery Fund (EFF), which has a budget of about EUR 4.305 billion for the period 2007–2013 (EC, 2010). Granting these subsidies has not so far led to a fundamental change in the fishery sector as fleet overcapacity and declining catches persist.
These and other factors led the European Commission to propose reforming the EU Common Fisheries Policy (CFP) in summer 2011. The proposal includes targets and timeframes to stop overfishing. The planned revision does not foresee the abolition of financial aid to the fishery sector but it provides that these funds should only be given to environmentally friendly initiatives contributing to smart and sustainable growth (EC, 2011d).
The fishery sector is also highlighted as a key sector in UNEP's recent green economy report (UNEP, 2011). The actions proposed in that report emphasise reorienting public spending as a means to strengthen fisheries management. In particular, subsidies are proposed to fund a reduction of excess capacity by decommissioning vessels.
The call for subsidies for the fishery sector is not at odds with the policy of reforming environmentally harmful subsidies globally. The goal of the proposed subsidies is to reduce the negative outcomes of past fishery policies and help achieve an environmental improvement, i.e. the recovery of the fish stock in the seas.
8. Water use and water stress
Life depends on freshwater – people, flora and fauna. At many locations and times (e.g. summer), however, over-exploitation poses a threat to the continued availability of our freshwater resources. A sustainable management approach, focusing on conserving water and using it more efficiently, can help address conserve drinking supplies and contribute to healthy and resilient freshwater ecosystems.
This chapter employs the indicator 'Use of freshwater resources' (CSI-018) as a proxy for both ecosystem resilience (i.e. the water exploitation index) and resource efficiency (i.e. water abstraction figures for different sectors). In addition, information on 'Household water use and water price' for selected countries illustrates water economics considerations and cost recovery in a green economy.
The water exploitation index (WEI) indicates the stress on freshwater ecosystems from over-abstraction. Where abstraction levels are high in relation to available resources, water stress may result, placing the resilience of associated freshwater ecosystems under threat. This does not, however, take account of impacts from other pressures (e.g. pollution), which may further influence ecosystem resilience.
Reduced water use is not a direct indicator of resource efficiency. When presented for key water-using sectors, however, it is a proxy for how we use water resources to meet, for example, our energy, food and public water needs. To assess progress in improving resource efficiency, this indicator should be seen alongside sectoral efficiency indicators (e.g. energy efficiency).
Other related EEA indicators and reports include (see Annex):
• Indicators and indicator sets: water (including CSI 18 to CSI 24)
• Towards efficient use of water resources in Europe (EEA, 2012)
• A series of reports on the state of water in Europe published in 2012
Water use and water stress
Europe's freshwater resources are crucial to human health and the European economy. All economic sectors depend on water for their development (Figure 8.1). As well as supplying household water requirements, the energy, agriculture, industrial and tourism sectors depend on reliable freshwater resources (EEA, 2009).
In Europe, humans appropriate on average around 13 % of all renewable and accessible freshwater from natural water bodies, including surface waters (rivers and lakes) and groundwater. When compared to the global average, this is relatively low. However, in many locations and at times (e.g. summer) in Europe, over-exploitation of available water resources poses a threat to freshwater resources (EEA, 2009).
Figure 8.1 A simplified illustration of water abstraction and return flows (as part of the freshwater cycle)
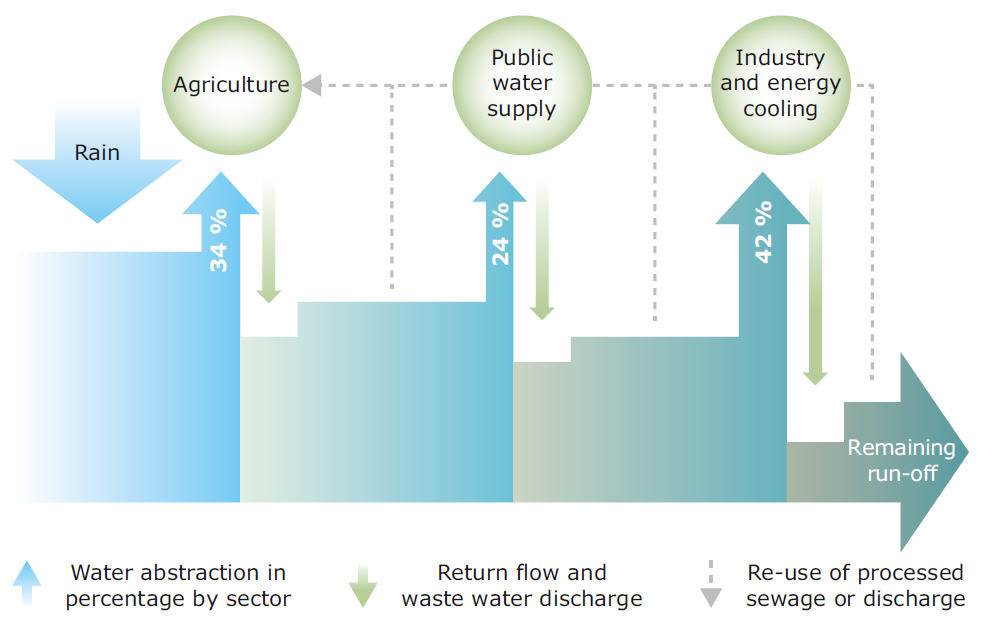
Note: As water is extracted and used along the supply chain, both the quality and quantity diminishes.
Source: European Environment Agency.
As a consequence, problems of water scarcity (where demand exceeds the available resource) are widely reported, especially in southern Europe. In 2007, the European Commission (EC, 2007) estimated that at least 17 % of EU territory had been affected by water scarcity and put the cost of droughts in Europe over the previous thirty years at EUR 100 billion — with significant consequences for the associated aquatic ecosystems and dependent users (EEA, 2009 and 2010a).
A sustainable approach to water resource management, focusing on both water quality and quantity, requires that society conserve water and use it more efficiently. Integral to this is a more equitable approach to water abstraction that addresses not only the requirements of competing economic sectors but also the requirements of healthy and resilient freshwater ecosystems (EEA, 2009).
Maintaining good ecological status of water bodies is key to ecosystem resilience
Across Europe as a whole, surface water ecosystems — rivers and lakes — supply most of the freshwater, mainly because it can be abstracted easily, in large volumes and at relatively low cost. Surface waters therefore account for 81 % of the total abstracted. Groundwater provides the predominant source (about 55 %) for public water demand, due to its generally higher quality than surface water and, in some locations, more reliable supply (EEA, 2009).
Human demand for water competes directly with the water required for maintaining ecological functions. Over-abstraction causes reduced river flows, lowered lake and groundwater levels, and the drying up of wetlands, resulting in detrimental impacts on these aquatic ecosystems, including on associated fish and bird life. Under these circumstances, ecosystem resilience may be directly undermined (EEA, 2009 and 2010a).
Where a water resource is diminished, a worsening of water quality normally follows because there is less water to dilute pollutants. In addition, salt water increasingly intrudes into 'over-pumped' coastal aquifers throughout Europe. Excessive abstraction from any one type of water body can also impact one or more of the others. For example, rivers, lakes and wetlands may all be strongly dependent on groundwater, especially in the summer when it typically provides critical base-flow, essential for maintaining healthy surface water ecosystems (EEA, 2009).
A relatively straightforward indicator of the pressure or stress on freshwater ecosystems from water use, is the water exploitation index (WEI), which conveys water abstraction as a percentage of the freshwater available. This indicator shows how total water abstraction puts pressure on water resources by identifying countries with high abstraction in relation to resources and which are therefore prone to water stress. Changes in the WEI help to analyse how changes in abstraction impact on freshwater resources by increasing pressure on them or making them more sustainable. The WEI provides a broad overview and only takes into account the stress arising from water abstraction. As such, it does not take into account other impacts from pressures such as pollution and fragmentation (CSI 18).
A water exploitation index above 20 % can indicate that a water resource is under stress due to water abstraction (Map 8.1). Based on Eurostat data available for the period 1985–2009, five European countries can be considered water-stressed (Cyprus, Belgium, Italy, Malta and Spain). However, national estimates of WEI do not necessarily reflect the extent and severity of over-exploitation of water resources in sub-national regions, or seasonal variation in water availability and water use. Calculations of WEI by catchments and river basin, rather than by country, would overcome some of the spatial limitations of the indicator but are not yet available (EEA, 2010a) (CSI 18).
Over-abstraction not only has a direct impact on the ecological health of aquatic ecosystems, but also reduces an ecosystem's capacity to absorb other pressures — from pollution, damming (e.g. fragmentation), dredging and other anthropological modifications, and the predicted impacts of climate change — without severe ecological implications. EU water policies, including the Water Framework Directive (2000/60/EC) (WFD), aim to ensure that the rates of extraction from water resources are sustainable over the long term (EEA, 2009).
While some progress is being made towards the WFD target (EEA, 2010a), which requires that EU aquatic ecosystems have a good ecological status by 2015, evidence suggests that many water bodies across Europe will not achieve this status in time. 'Good ecological status' implies that water bodies have sufficient water volumes, flows and depths, as well as suitable nutrient, pollutant and salinity levels, temperatures and associated flora and fauna, to protect natural ecosystems and biodiversity (among other things) (EC, 2010a) and ensure resilience, including against the impacts of climate change. In order to reach the WFD target, it will be critical that water abstraction levels are balanced against ecosystem requirements (e.g. by establishing quantitative 'environmental flow' targets), incorporating the need to ensure ecosystem resilience (EEA, 2010b) (CSI 18).
The forthcoming 'Blueprint to safeguard Europe's water' being prepared by the European Commission, will guide the integration of resource efficiency into water-related policies. It will also review how existing legislation can be implemented to achieve sustainable water resource management, and ensure integration across all natural resources.
Map 8.1 Water exploitation index (based on 2009 or latest available data)
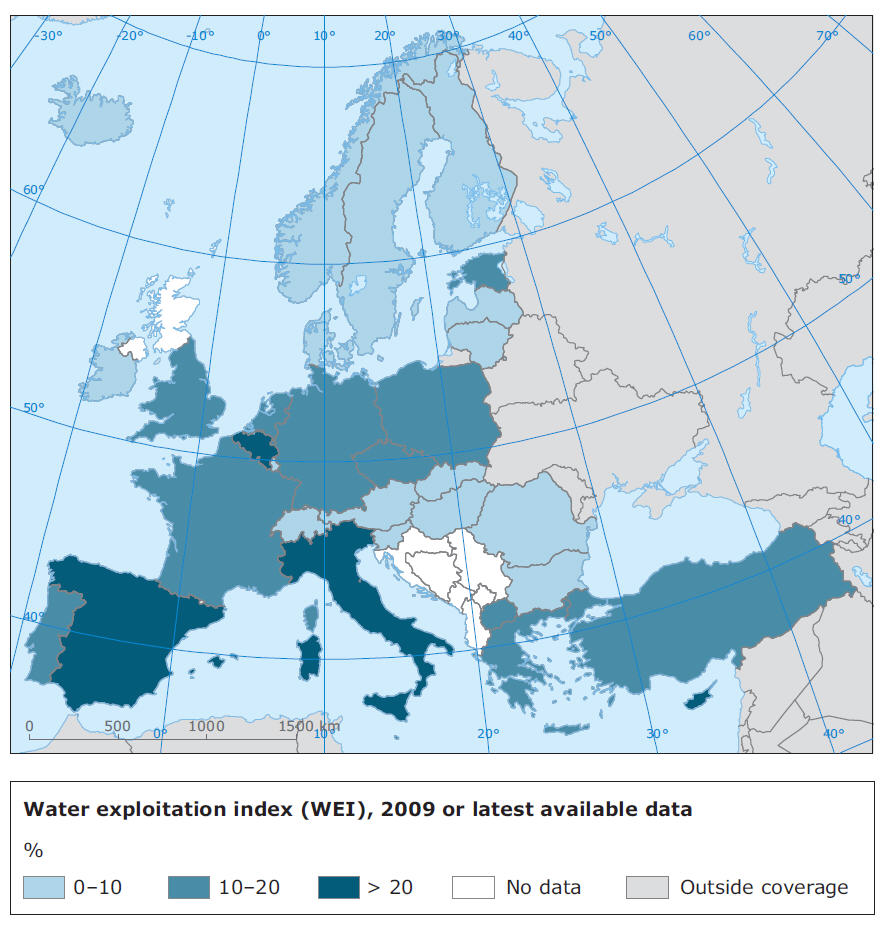
Note: WEI calculations based on: 2009 for Bulgaria, Cyprus, Czech Republic, Denmark, Estonia, Lithuania, Former Yugoslav Republic of Macedonia, Luxembourg, Malta, Poland, Romania, and Slovenia; 2008 for Hungary, the Netherlands, and Spain; 2007 for Sweden, Belgium, France, Germany, Greece, Ireland, Latvia, and Slovakia; 2006 for England and Wales, and Switzerland; 2005 for Iceland; 2001 for Turkey; 1999 for Austria and Finland; 1998 for Italy and Portugal; 1985 for Norway.
Source: CSI 18 indicator.
Managing water use and demand to improve efficiency in all sectors
Water resource management differs from the management of other resources, due to the unique characteristics of water as a resource: water moves via the hydrological cycle and is dependent on climatic influences, and its availability varies across time and space. Use by one sector can remove, pollute or fragment connectivity of water resources, thereby reducing the availability for others (EEA, 2010b).
In Europe as a whole, agriculture uses around one third of freshwater abstraction. Another third is used for cooling in energy production, while public water supply uses approximately one quarter. The remainder is used by industry. These figures should, however, be interpreted with caution. First, EU-wide data mask regional differences (EEA, 2009). Second, the different sectors vary greatly in how they use water. For example, in the agricultural sector consumption of water through crop growth and evaporation typically means that only about 30 % of the amount abstracted is returned to the aquatic ecosystem from which it was taken. Contrastingly, energy production returns most of the water it uses, albeit in altered state, e.g. at a higher temperature (CSI 18).
Water abstractions for agriculture (irrigation) have decreased in most countries over the past two decades. Since the early 1990s, there has been a very large decrease in water abstraction for irrigation in eastern Europe, mostly due to the decline of agriculture in Bulgaria and Romania during the period of economic transition. In the remaining eastern EU countries, total irrigable area has declined by about 20 %, with associated reductions in water use. Water abstraction for irrigation has remained relatively stable in southern Europe except in Turkey, where it has increased by more than 30 % from the 1990 level. In southern Europe there is a tendency to use irrigation water more efficiently, with a higher proportion of the area using drip irrigation than in other parts of Europe. Meanwhile, the use of recycled water in these areas has also increased (EEA, 2009) (CSI 18) (Figure 8.2a).
Water abstraction for power plant cooling in Europe has decreased overall by more than 10 % over the last 10–15 years, due mainly to implementation of advanced cooling technologies that require less water. It is worth noting that while most of the water is returned after use, and gains have been made in reducing the volume of water required in the first instance, the altered characteristics of returned water have impacts on ecosystems (e.g. thermal pollution) (Figure 8.2b).
The abstraction of water for industrial and manufacturing uses has decreased over the past 20 years, ranging from a 10 % reduction in western European countries, up to a 40 % reduction in southern European countries and even greater reductions in eastern countries. The decrease is partly because of the general decline in water-intensive heavy industry but also because of increases in the efficiency of water use (CSI 18) (Figure 8.2c).
Figure 8.2 Water abstractions by water use sector in the 1990s and the period 1997–2009 (latest year)
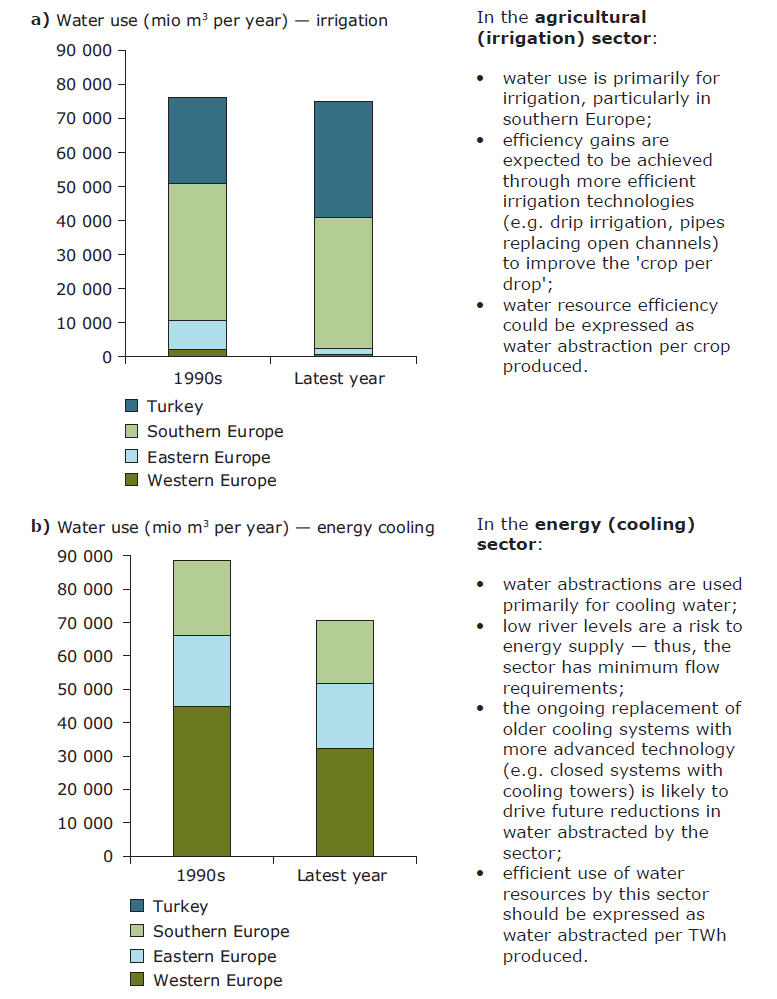
Note: Figures for the energy sector for Turkey do not include water used for cooling water.
Source: Based on CSI 18 indicator; for further details on data coverage see explanatory note in the References section (p. 148).
Regarding abstraction for public water supply, a range of factors influence abstraction rates and volumes, including population and household size, tourism, income, technology and lifestyle. In southern Europe, domestic water use has increased since the early 1990s by 12 %, with increases above 50 % in Turkey. At the same time, public water demand in eastern Europe has declined by 40 % as a result of higher water prices and the economic downturn. A similar but less marked reduction in demand is apparent in western Europe over recent years, driven by changes in awareness and behaviour and increases in water prices (CSI 18) (Figure 8.2d).
Public water supply sectors: water pricing and other incentives to save water
The EU Water Framework Directive (WFD) acknowledges that modern water management needs to take account of environmental, economic and social functions throughout an entire river basin (EEA, 2007). Indeed, more and more countries are considering both supply and demand in their river basin management plans, and particularly in their public water management (EEA, 2010a).
As noted earlier, a number of factors influence public water demand. Reductions in public water demand in eastern and western Europe since the 1990s have been partially driven by increased awareness and use of water saving devices, alongside increases in water prices, introduced in accordance with the requirements of the WFD (EEA, 2009) (see for example Figure 8.3).
Water pricing and governance are among the strategies and measures employed to encourage sustainable use. The WFD requires Member States to take account of recovery of the costs of water services (including environmental and resource costs) from users including farmers, industry and ordinary household consumers, based on the polluter-pays principle (EEA, 2007, 2010a).
Although there are wide variations in water charges across Europe because of, for example, different attitudes to cost recovery, in real terms water prices have tended to rise over the past 20 years. There is not a simple cause-effect relationship between water prices and household water use, however, and it is likely that increased prices are just one of several factors contributing to decreased household water use (EEA, 2007, 2010a).
The price and price structure (volumetric and non-volumetric components) set for water depends not only on taxes and environmental costs, but also on cost-recovery for infrastructure investments. Consumer responses to prices depend on the pricing structure, the link to water metering and access to water saving devices (EEA, 2012).
Water metering has provided a high incentive to save water, and experience shows that households with water meters (and associated charges) generally use less water than those without them. Currently, only some European countries meter the majority of water uses; often metering is still limited, especially relating to agricultural water use.
Figure 8.3 Water pricing and household water use between 2000 and 2009/2010 in Spain (left) and Estonia (right)
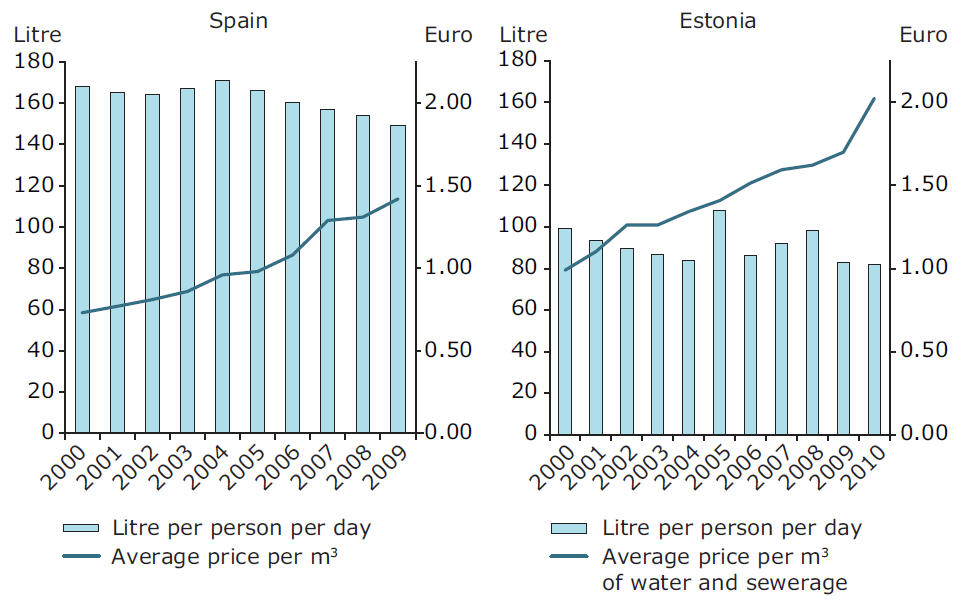
Source: Instituto Nacional de Estadística, Spain; Water Works Association and Environment Information Centre, Estonia.
Box 8.1 The Water Framework Directive and water economics
Many have advocated the use of economic instruments as an effective means to promote the protection of the environment and water resource in particular. The OECD has concluded that 'pricing the use of environmental resources has proven to be a powerful tool for influencing consumer and household decisions'. This finding is based on a survey of 10 000 households in OECD countries revealing that households who are metered and pay for water consumption use approximately 20 % less water than uncharged households (OECD, 2011).
The adoption of the EU Water Framework Directive (WFD) in 2000 has marked a clear shift in the European debate on water and economic instruments. Indeed, in its Article 9, the Directive asks Member States to take account of the recovery of the costs of water services (including environmental and resource costs), assessed at the level of different sectors (disaggregated into agriculture, households and industry). It also requires that water pricing policies provide adequate incentives for efficient water use, thus contributing to the environmental objectives of the WFD.
The European Commission further highlighted water pricing as a central element in water resource management in its Communication on water scarcity and droughts (EC, 2007). Water economics and future implementation will also be an important element in the 'Blueprint to safeguard Europe's water'.
EU Member States have implemented taxes in the water sector, addressing both water quantity and quality. Water abstraction taxes targeting priority households and industry can be found in many Member States (for example, Denmark, Germany and the Netherlands). Their structures are similar — mostly volumetric but with different tax rates depending on the user and usage, and also depending whether water is abstracted from groundwater or surface water.
Water pollution or emission taxes address water quality and refer to the chemical quality of water bodies. The level of taxation is based on both the volume and the pollution content of effluents and tax rates may also differ between sectors. The pollutants most subject to such taxes are organic pollutants (COD and BOD), nutrients (nitrates and phosphorous), heavy metals and suspended solids (see also EC, 2001; EEA, 2005).
9. Use of material resources and waste management
The use of material resources — including renewable resources, such as biomass, as well as non-renewable resources, such as fossil fuels, metals and non-metallic minerals — have been central to our economies for centuries. Their use is closely linked with a range of environmental pressures, including waste generation. In the EU, the average individual uses just under 15 tonnes of materials annually and generates more than five tonnes of waste.
This chapter focuses on two aggregate indicators: 'Ecological footprint' (SCP-01) and available biocapacity as a proxy for ecosystem resilience; and 'Domestic material consumption (DMC)' (SCP-04, based on Eurostat data) compared with gross domestic product as a proxy for resource efficiency. In addition, an indicator on 'Municipal waste generation' (CSI 16) illustrates progress in recycling towards a 'closed-loop' green economy.
Measuring how resilient our resource base is poses a conceptual challenge. For some material resources, current and potential future scarcity may be the key issue, while for others environmental impacts associated with their use are of concern. The ecological footprint indicator presented here primarily addresses the former, illustrating the extent to which we may be 'over-using' resources.
Debate continues regarding which indicators are best suited to measuring resource efficiency. The ratio of GDP to DMC has been identified as a provisional headline indicator in the EU's 'Roadmap to a resource efficient Europe'. DMC describes material use but it does not distinguish well between different materials and the environmental impacts of their use. The Roadmap therefore also calls for further work on indicators and targets.
Other related EEA indicators and reports include (see Annex):
• Indicators and indicator sets: sustainable consumption and production (SCP), waste (including CSI 16 and CSI 17).
• Resource efficiency in Europe (EEA, 2011a).
• Earnings, jobs and innovation: the role of recycling in a green economy (EEA, 2011b).
Use of material resources and waste management
Our economies are built on the use of material resources. These comprise renewable resources, such as biomass (including agricultural products or timber), and non-renewable resources, such as fossil fuels, metals and non-metallic minerals (including sand, gravel and limestone). Over the last century the use of materials has increased globally by a factor of eight: this has supported our way of life but has also resulted in negative environmental consequences.
The use (and in some cases over-use) of renewable resources and biomass has put the sustainability of these natural resources at risk. The previous chapters have highlighted that today fish stocks, for example, are threatened due to overfishing, and biodiversity is under threat in areas of intensive agriculture. Another example is deforestation, which has led to erosion washing away nutrients from soils, and to some degree threatened the ability of ecosystems to absorb greenhouse gas emissions.
The use of non-renewable resources has raised similar concerns. Use of fossil fuels leads to concerns about the ever increasing emissions of greenhouse gases, and destruction of habitats by large-scale operations or major accidents. Extraction of non-metallic minerals for construction affects landscapes, changes local hydrogeological conditions, and results in huge volumes of wastes. Many of these problems are also common to the extraction and smelting of metals, which additionally requires huge amounts of energy and leads to air emissions.
In addition to these examples of environmental consequences, the fast increasing global demand for many materials has radically increased concerns in Europe about ensuring long-term security of supply of key resources in recent years (EC, 2008; EC, 2011a). The risks are especially acute for those materials where import dependency is already high, such as fossil fuels or some metals for which no substitutes are readily available.
The unprecedented speed and scale of changes in the use of resources observed over the past few decades has increased the need for improved data and indicators to describe key material resource trends at all levels of the economy — the macro, sectoral and product scales. To help monitor these, an accounting methodology, economy-wide material flow analysis (EW-MFA), can be used to derive indicators describing the material throughput and material stock additions in a national economy (Eurostat, 2012).
Domestic material consumption (DMC) has emerged from the EW-MFA as a key descriptor of how an economy uses resources. The ratio between GDP and DMC has been adopted as a provisional lead indicator under the EU's 'Roadmap to a resource-efficient Europe' (EC, 2011b). There remains a need, however, for broader and more disaggregated analysis to convey the relative significance of various materials and the related impacts — and their potential for re-use, recovery or recycling (see Figures 9.1 and 9.2 and Table 9.1)).
Figure 9.1 Links between the use of material resources and waste generation in an economy
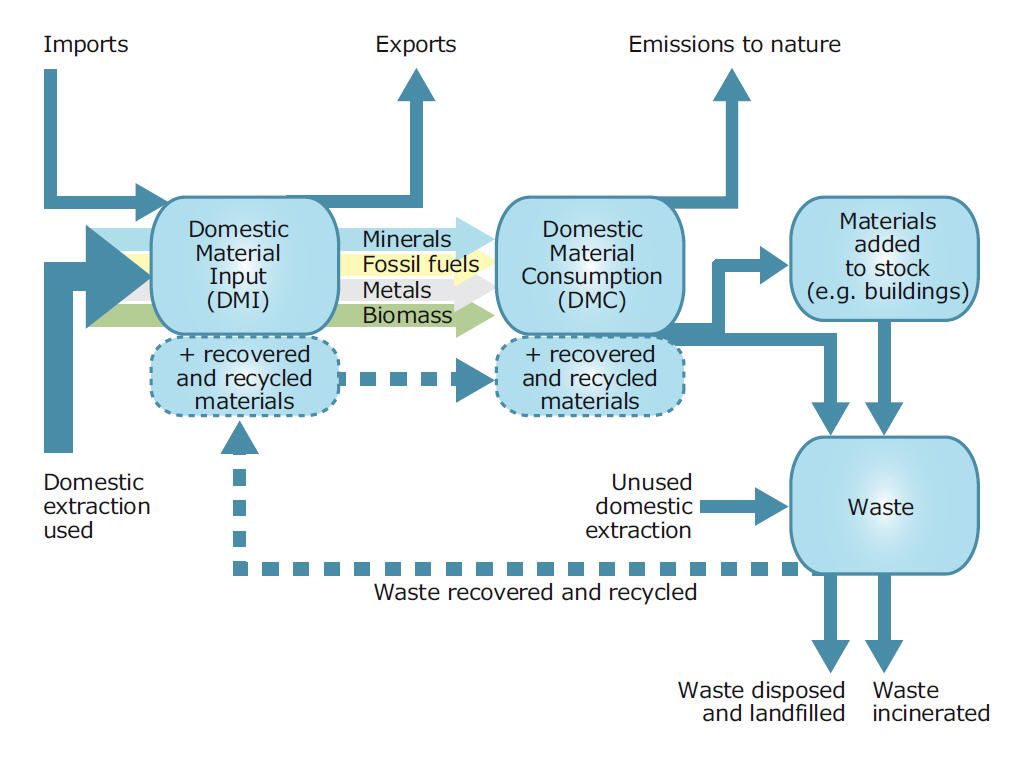
Source: European Environment Agency.
Figure 9.2 Domestic Material Consumption (DMC), split by category, in EU-27, 2009
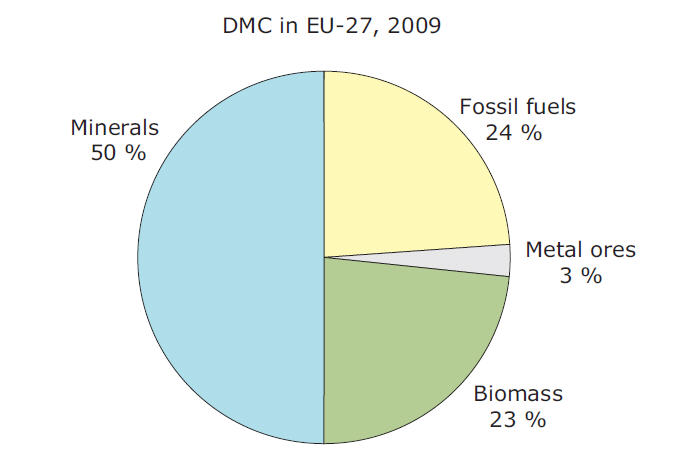
Source: Wuppertal Institute, based on Eurostat MFA database.
Table 9.1 Domestic Material Consumption (DMC), most significant materials by mass in EU 27, 2009
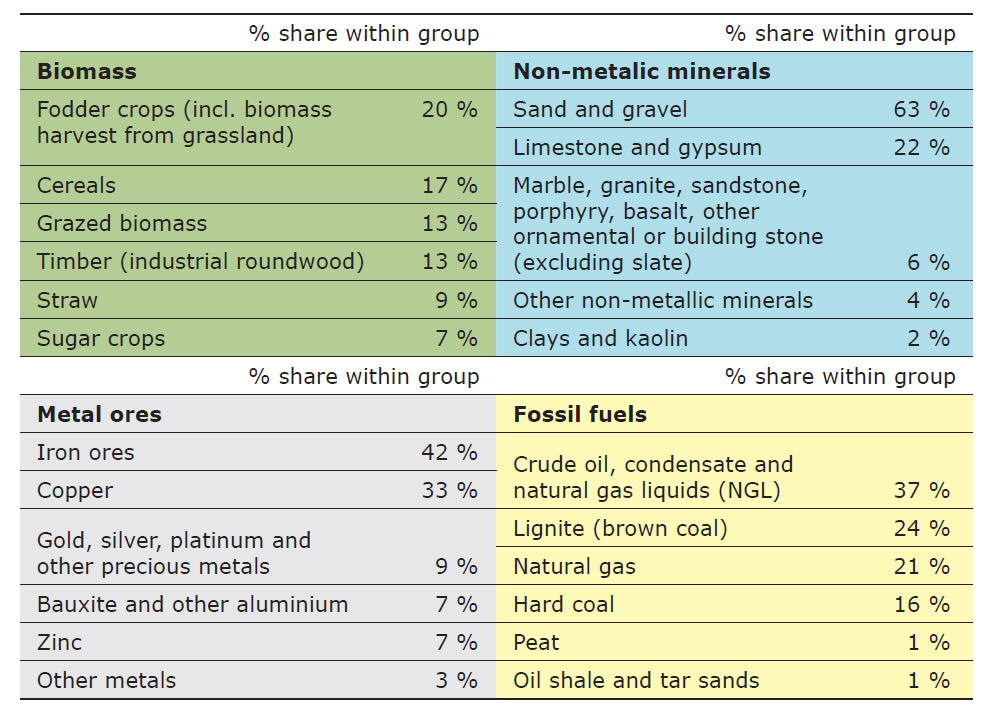
Source: Wuppertal Institute, based on Eurostat MFA database.
Furthermore, it is worth noting that the EW-MFA is limited to material resources, leaving aside other important issues. As a result, the 'Roadmap to a resource efficient Europe' provides that the GDP per DMC indicator should be complemented by 'a "dashboard" of indicators on water, land, materials and carbon and indicators that measure environmental impacts and our natural capital or ecosystems as well as seeking to take into account the global aspects of EU consumption. On a third level, thematic indicators will be used to monitor progress towards existing targets in other sectors' (EC, 2011b).
Acknowledging limits in the supply of renewable and non-renewable resources
The Earth is a closed material system, and this sets certain limits to economic growth based on continuously increasing use of resources. Some limits are related to the availability of natural resources, where the environment plays the role of a 'source'. Although for a number of non-renewable resources (including construction minerals and plentiful metals such as iron), security of supply does not currently give a cause for concern, for others, such as fossil fuels and some metals, availability is already becoming a problem and one which is almost certain to grow.
For other resources such as fish stocks, forests or water, the key challenge is to ensure sustainable regeneration by safeguarding the reproductive capacities of ecosystems (known as 'maintaining natural capital'). The limits in the supply of renewable natural resources have given rise to concerns, as illustrated by the ecological footprint (Ewing et al., 2010). Since 1961, Europe's ecological footprint has exceeded the available biocapacity. The gap between the two has been continuously increasing representing an increased reliance on natural resources outside Europe (Figure 9.3).
Figure 9.3 Ecological footprint compared with biocapacity (left), and different components of the footprint (right) in EEA countries, 1961–2007
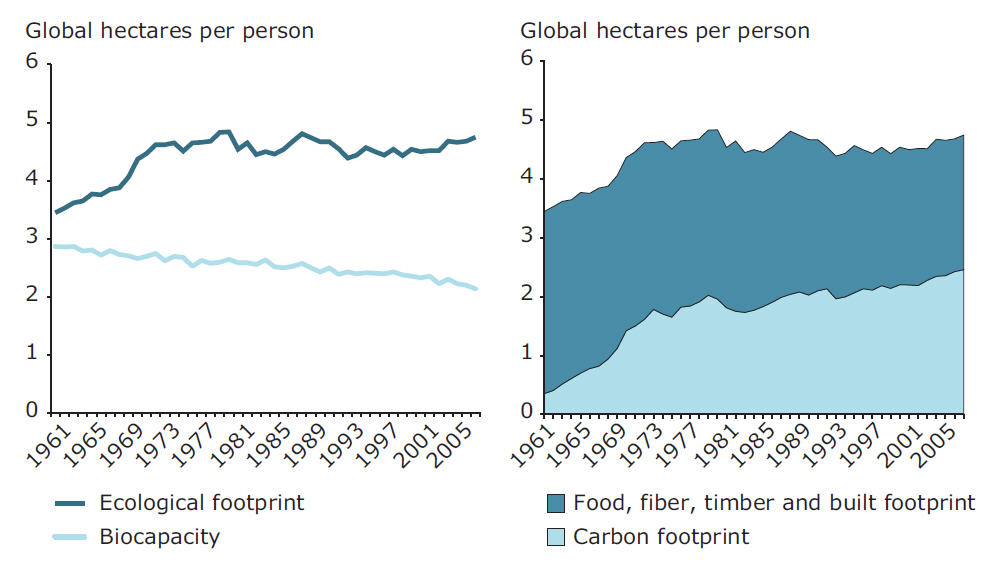
Note: The ecological footprint is a measure of the area needed to support a population's lifestyle. This includes the consumption of food, fuel, wood, and fibres. Pollution, such as carbon dioxide emissions, is also counted as part of the footprint. Biocapacity measures how biologically productive land is. It is measured in 'global hectares': a hectare with the world average biocapacity. Biologically productive land includes cropland, pasture, forests and fisheries.
Source: SEBI 23 indicator, based on data from Global Footprint Network.
At the same time, Europe's biocapacity has decreased, indicating a reduced ability to sustain our needs based on resources within Europe. Today, we are using more than double the available biocapacity in Europe, and this deficit is widening.
In addition to influencing ecosystem resilience, the use and security of supply of material resources strongly affects Europe's economic resilience. Most non-renewable resources are finite and some may be nearing the point of exhaustion — including strategic materials such as oil or natural gas. International competition for access to some resources — e.g. water, land, food, or rare earth metals — could and in some cases already has resulted in international tensions or open conflicts. Ensuring long-term stable access to resources has become a major strategic economic concern for Europe, whose open economy relies heavily on imported materials.
In the European Union, the average share of imports in the total use of materials (as measured by DMC) is about 20 %. However, this covers a range from some 3 % for construction minerals and 11 % for biomass, to about 75 % for metals. The latter category includes some 50 % for copper, 65 % for zinc, about 85 % for tin, bauxite and iron ores, and even 100 % for a wide range of high-tech metals. The growth in import dependence is fastest for fossil fuels, where the share of imports in 2009 was 42 % for natural gas, 58 % for coal and 88 % for oil.
Through these growing imports, the environmental pressures from our resource use increasingly occur outside EU borders. Although the European Union's average domestic material consumption fluctuates between 15 and 17 tonnes per person, globally the material 'footprint' of a European citizen has been estimated at between 45 and 50 tonnes per year. In addition to domestic extraction and imports, the latter figure includes unused extraction within Europe and so-called 'hidden flows' of imports in the rest of the world (their sum is known as total material requirement, TMR).
All in all, Europe is making increasing demands on the environment both in Europe and in the rest of the world, with consequent negative impacts on natural areas and biodiversity. In addition, we now prospect for resources in previously unexploited, far away and fragile environments, such as the Arctic, tropical rainforests and the ocean floor, thus putting additional pressure on ecosystem resilience in sensitive environments.
Decoupling economic growth from material consumption
Use of material resources in the European Union as a whole declined by 3 % between 2000 and 2009. However, the change was strongly influenced by the economic downturn which started in 2008 (Figure 9.4). After a peak in 2007 at 8.3 billion tonnes measured as DMC (nearly 17 tonnes per capita), use of resources declined to 7.3 billion tonnes (just under 15 tonnes per person) in 2009.
DMC declined by 10 % between 2000 and 2009 in the EU-15, while in the EU-12 the figures increased by 28 % for all materials combined, and by 82 % for minerals for construction and industrial use. At the country level, the use of resources declined between 2000 and 2009 in 12 out of 27 EU Member States. However, only in Germany, Hungary, Italy and the United Kingdom was this decline a long-term trend rather than a result of economic contraction.
Figure 9.4 Trends in the use of material resources in EU-15, 1970 to 2010 (top) and EU-12, 1992 to 2010 (bottom)
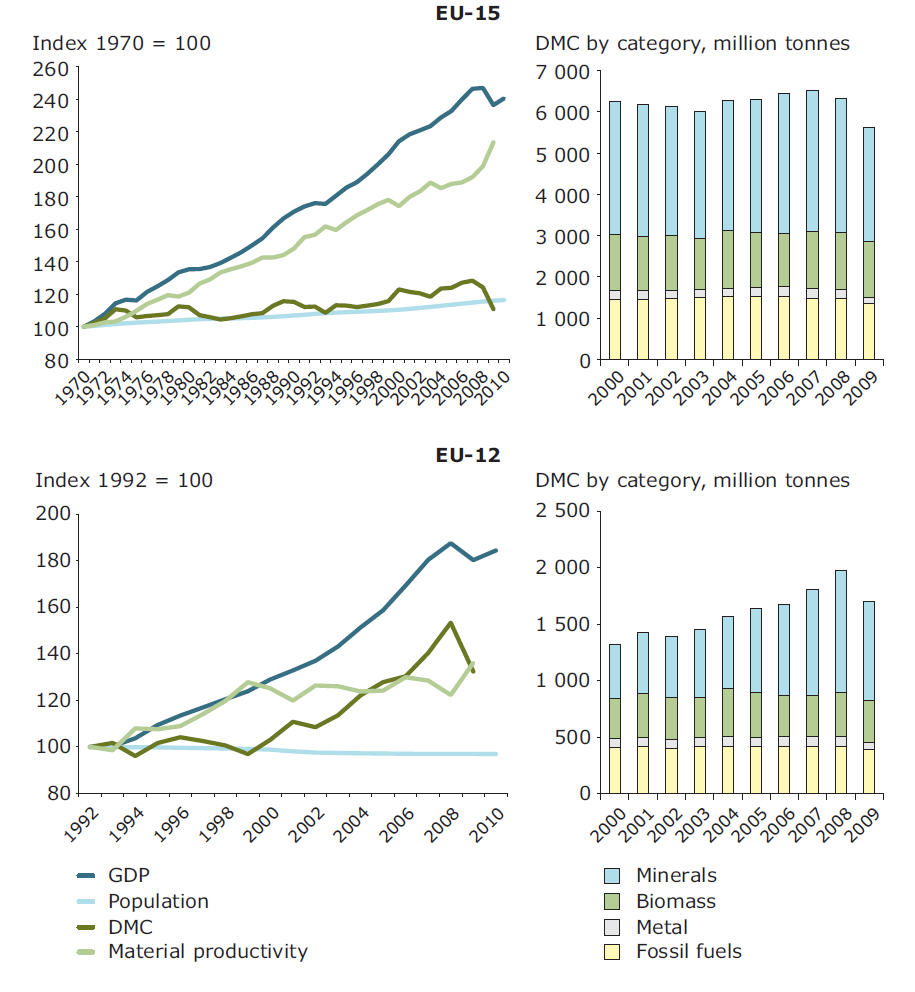
Note: Change 2000 to 2009 in EU-15/EU-12: Total DMC (– 9.9/+ 28.4 %);
Biomass (– 2.4/+ 5.8 %); Metals (– 35.9/– 22 %);
Non-metal minerals (– 13.5/+ 82.4 %); Fossil fuels (– 5.6/– 5.1%).
EU-15 includes Austria, Belgium, Denmark, Finland, France, Germany, Greece, Ireland, Italy, Luxembourg, the Netherlands, Portugal, Spain, Sweden and the United Kingdom.
EU-12 includes Bulgaria, Cyprus, the Czech Republic, Estonia, Hungary, Latvia, Lithuania, Malta, Poland, Romania, Slovakia and Slovenia.
Source: EEA, 2010 and Eurostat, 2012.
In recent years, EU policies have called for 'breaking the linkages between economic growth and resource use' (EC, 2002) — and Europe has indeed recorded some success in decoupling resource use from economic growth. Between 2000 and 2009, resource efficiency (measured as GDP/DMC) in the European Union improved by over 15 %, although the increase was almost twice as high in the EU-15 as in the EU-12. Effectively our economies are creating more and more wealth out of the resources that they use.
Nevertheless, in most countries enhanced resource efficiency only produced a relative decoupling of resource use from economic output — the economy grew faster than use of materials, in other words. Furthermore, some of the apparent improvement may have been achieved as a result of increased imports substituting for domestic production. In absolute terms, Europe is increasingly relying on resources extracted and processed abroad.
Managing waste to encourage the shift towards a recycling society and a green economy
Using material resources and generating waste are two sides of the same coin. Waste is a potential resource when re-used, recycled or recovered. Waste that is merely disposed of can be interpreted as a loss of resources and thus as an inefficiency of the economy.
In order to capture the resource potential of waste and to reduce environmental impacts of waste management in Europe, the EU has introduced the 'waste hierarchy' and aims to become a 'recycling society'. The EU 'Roadmap to a resource efficient Europe' reinforces this approach.
The amount and share of waste recycled gives an indication of whether the economy is moving closer to being a recycling society or closed-loop economy. In 2008, some 2.7 billion tonnes of waste were generated in EEA member countries, Croatia and the former Yugoslav Republic of Macedonia. Almost two thirds of the total was mineral waste, mainly from mining, quarrying, construction and demolition (Figure 9.5). Some 2.5 billion tonnes were reported as treated. Half of this waste was disposed of, 45 % recovered and 5 % incinerated.
Figure 9.5 Total waste generated by type in the EU-27, Croatia, the former Yugoslav Republic of Macedonia, Norway and Turkey, 2008
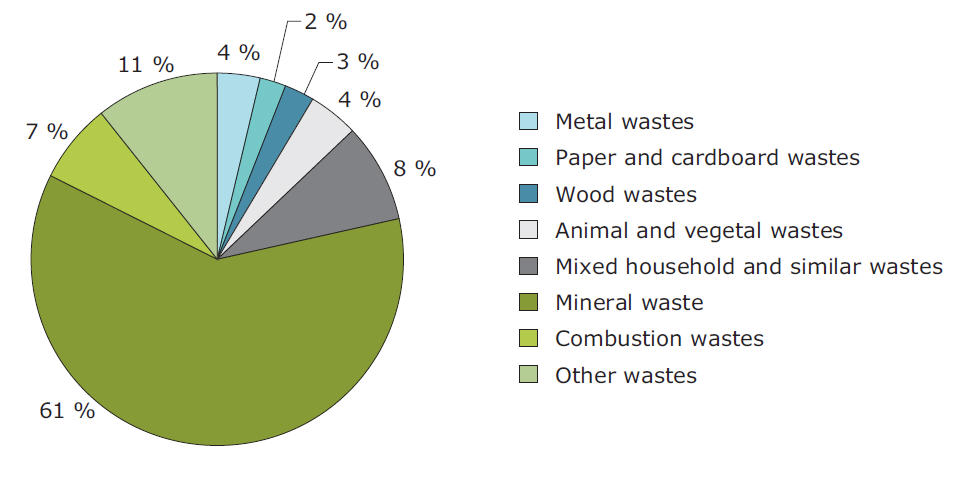
Source: Eurostat Data Centre on Waste.
Figure 9.6 Development of municipal waste management in the EU-27, 1995–2010
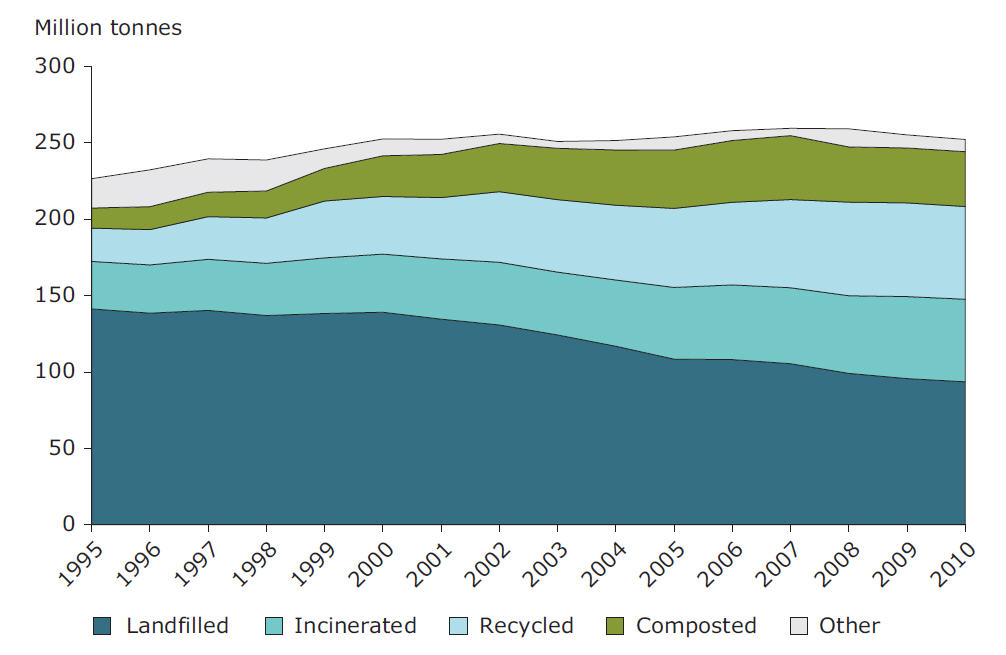
Source: CSI 16 indicator, based on data from the Eurostat Data Centre on Waste.
For municipal waste, the share recycled or composted increased to 38 % of the generated amount in 2008, compared to 25 % in 2000 (Figure 9.6). This development was triggered by national and EU policies, for example the EU Landfill Directive (1999/31/EC), the Packaging and Packaging Waste Directive (94/62/EC) and the Waste Framework Directive (2008/98/EC). The amount of recycled metals, paper and cardboard, and glass waste in the EU increased by 4 million tonnes (3 %) between 2004 and 2008, whereas plastics recycling stagnated.
Recycling of packaging waste and of waste electric and electronic equipment (WEEE) is also increasing (CSI 17). The longer-term trend in the amounts of waste generated indicates, however, that materials could be used much more efficiently in the economy. It remains to be seen whether the recent decrease in amounts of total, municipal and packaging waste becomes a trend or whether waste generation 'recovers' together with the economy.
There is a potential to source a considerably larger part of the materials used in the economy from recycled waste. In some cases, such as WEEE, the main challenge is to collect the waste in such a way that it can be recycled or re-used. WEEE contains significant amounts of valuable materials, including gold, copper, aluminium and rare metals, some of which are considered critical for the EU economy. In 2008, however, the collection rate (from households and other sources) was only around 33 % by weight of amounts put on the market in 2008 (14).
Another challenge is to make sure that the recycled materials match the quality demands of industry. New recycling technologies and product design that enables easy and high-quality recycling and re-use will be essential to capture the full resource potential of waste.
Box 9.1 Strategic waste management and job creation
The EU Waste Framework Directive (2008/98/EC), revised in 2008, is the cornerstone of EU waste policy. It introduced the five-step waste hierarchy, with waste prevention as the best option, followed by re-use, recycling and other forms of recovery including energy recovery. Disposal is the least preferred option. Furthermore, life-cycle thinking was also introduced as a new waste policy concept. Today EU waste legislation has a strategic approach to waste and resources, and manages different waste streams by setting specific recycling targets. For example, the 2015 target for recycling of vehicles will be 85 % and the recovery target (including energy recovery) will be 95 %.
Recycling is seen as a key measure to decrease the amount of landfilled waste while reducing the extraction and imports of materials used in the economy. It thereby links environmental considerations with economic benefits. During recent years the recycling sector has attracted increasing attention as it employs about 500 000 persons and has a turnover of EUR 24 billion. The total number of EU-27 jobs in the waste management and recycling sector has been estimated at some 1.8 million (Ernst and Young, 2006). Moreover, the European waste management and recycling sector has a global market share of 50 % (EC, 2007).
A recent study revealed that the annual growth in employment in this sector was about 7 % per annum between 2000 and 2007 (ETC/SCP, 2011). It is further estimated that more than 560 000 new jobs could be created if the EU achieved a recycling target of 70 % for key materials (Friends of the Earth, 2010).
Notes:
(5) 1 teragram (Tg) = 1 000 000 000 kilograms (kg). > back
(6) Studies show that emission levels of approximately 39–44 Gt CO2-eq in 2020 would be consistent with a 'likely' chance of limiting global warming to 2 °C (UNEP, 2011). > back
(7) 'The climate system' refers to the totality of the atmosphere, hydrosphere, biosphere and geosphere and their interactions (UNFCCC, 1992). > back
(8) This excludes emissions from international aviation and international maritime navigation. > back
(9) European Union emissions in 2010 have been estimated to be around 4.7 CO2-eq (EEA, 2011b). > back
(10) A temperature increase of 2 °C or 1.5 °C represents an increase in the global average near surface temperature compared with pre-industrial times. These global average increases can translate into much higher temperature changes locally. > back
(11) This objective translates into saving 368 million tonnes of oil equivalent (Mtoe) of primary energy (gross inland consumption minus non-energy uses) by 2020 (EC, 2011b). > back
(12) 120 mg O3/m3 daily maximum 8-hourly average, not to be exceeded more than 25 times a calendar year by 2010, averaged over three years. > back
(13) Estimates for the impact of European policies on NOX and SOX emissions are not available for the period 1990–2009. > back
(14) This represents the average figure based on aggregated available data from 27 European countries. > back

Document Actions
Share with others