5. Information reported to the Commission under Council Directive 92/72/EEC in 1994-1996
5.1 Monitoring stations
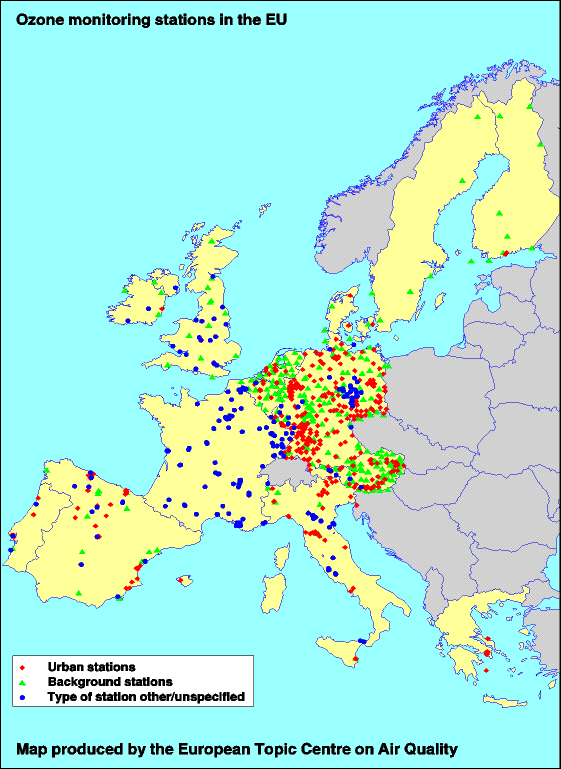
Table 5 presents a summary of the number of sites from which data was transmitted by the Member States covering their 1995 measurements (de Leeuw and van Zantvoort, 1996). The table also consists of an overview on meta-information attached to the data reports. Figure 9 shows the locations of the stations and Figure 10 presents the different types of stations. Data for 1994 were submitted by 15 Member States for 782 monitoring sites. However, the data was complete from 10 countries only (de Leeuw et al., 1995; van Zantvoort and Sluyter, 1995). For 1996 data from 836 stations within 13 countries was reported (De Leeuw and van Zantvoort, 1997). From Figure 9 it is obvious that the spatial coverage of the network needs improvement in several countries and Figure 10 reveals that gaps in the geographical coverage can be noted in both urban and rural monitoring. Some countries have not submitted data from rural sites, whereas others interpret the concept of urban monitoring to address only 'street' stations.
Table 5: Overview of the parameters and number of sites from which ozone data for 1995 were reported by Member States (de Leeuw and van Zantvoort, 1996)
| Parameter |
Number of Member States |
Number of sites |
· statistics/percentile values
· # of exceedances of threshold values
· geographical co-ordinates of sites
· surroundings: information on local environment
· information on measurement method
· information on calibration method
· type of site (rural, urban, street, other)
· altitude above sea level
· town where site is located
|
15
15
15
14
15
14
14
15
15
|
844
812
855
745
831
720
725
815
832
|
NOx statistics
NO2 statistics
VOC statistics
|
6
7
2
|
97
124
11
|
These data are intended to support the Commission in its aim to:
- assess regions with (un)acceptable air quality;
- promote the state of knowledge concerning the harmful effects of ozone and its impact on human health and the environment;
- build up knowledge on effective and appropriate measures to reduce pollution by ozone;
- monitor trends in ozone and the impact of national and Community provisions to reduce ozone precursors.
These objectives all centre around one basic issue: "Does the network sufficiently cover the areas of high and typical air pollution exposure of the population and vegetation?" We have performed three calculations to give an indication of the spatial representativeness of the stations from which data and classification were reported by the countries on their 1995 ozone measurements. This analysis is based on measurement stations only and it does not include supplementary information from assessment methods other than monitoring which may be used in several countries. These additional assessments may significantly enlarge the representativeness of the various ozone networks. In two calculations each rural site was given a radius of spatial representativeness of 50 km and 100 km respectively. The land cover from broad-leaved and coniferous forest and arable land within 50- and 100-km radius circles centred on each station were calculated and summed per country. In a third calculation a representative radius of 10 km was used for urban/street sites to estimate the number of people living in a city where ozone monitoring is taking place. This 'radius of spatial representativeness' is expected to vary among different regions in Europe. It is probably dependent on local conditions such as the wind direction, land-use, the vicinity of NOx emissions and possibly other factors. These calculations should therefore be considered as tentative estimates.
The computations indicate that the spatial coverage of the 1995 ozone monitoring network is insufficient to appraise the ozone situation over all Member States. The current subset of rural/background stations in the EU15 countries is estimated to cover a maximum of 20 - 40% of forests and 30 - 50% of crops, both depending on the chosen radius of representativeness of the observatories. Even if a radius of 100 km is used, the coverage of arable land is below 25% for four Member States. This number increases to eight countries if a 50 km radius is used. The subset of urban/street sites covers no more than 12% of all EU15 residents and approximately 25% of EU15 city dwellers (city defined as more than 50,000 inhabitants).
Although the Directive states that: "Member States shall provide the Commission with [...] a description of the area covered by the stations, and the site-selection criteria [...]" this has not resulted in effective provision of information. The current labelling as 'rural', 'urban', 'street' and 'other' without any spatial indication or explanation on a station's local environment is insufficient. In future our estimates may be improved if better documentation on the spatial representativeness of individual stations is made available by the Member States. Countries may consider to supplement their data reports with information on locations where similar air pollution situations may be expected.
5.2 Summary of data reported
Table 9 to 13 in Appendix 2 present the occurrence of exceedances of the various thresholds during 1994, 1995 and 1996. The tables are compiled from annual ozone reports prepared for the Commission (De Leeuw et al., 1995; De Leeuw and van Zantvoort, 1996, 1997). These tables present the average number of exceedances observed per country; i.e. the total number of exceedances summed over all monitoring stations in a country divided by the total number of sites in that country. The exceedances over the population warning threshold are not included, because this threshold is only exceeded a handful of times annually. The tables in Appendix 2 show that most thresholds are exceeded in all EU15 Member States every year. However, hourly peak concentrations in excess of the population information and the vegetation protection thresholds are rarely, or never, observed at Finnish, Danish and Irish stations during the period covered by the data. The health protection threshold, in particular 8 hr average for the period 12:00 and 20:00 hours, has on the average been exceeded during more than 4 weeks (not necessarily consecutively) in the networks of 3-6 countries annually.
Table 6 and 7 present reported percentile statistics and maximum observed concentrations, based on 1-h and 8-h moving averages in 1994, 1995 and 1996. In these tables the lowest and highest values observed at individual stations with a data coverage of 75% or more is shown. Note that the networks in various countries may have changed during the three years covered. The minimum and maximum values do not necessarily refer to the same sites.
5.2.1 Interannual variation
The time series reported in the framework of the Ozone Directive (1994 - 1996) are too short to draw conclusions on trends and the magnitude of interannual variation. Furthermore, co-located data on NOx are not available, which makes it hazardous to resolve trends in ozone. The quantity of Ox (NO2 + O3) is often a convenient parameter to overcome the disturbing influence of local emissions of NO.
Percentile data from 7 north-western Member States covering a longer period (maximum 7 years) were available to De Leeuw and van Zantvoort (1997) and these allow us to briefly consider the interannual variation. De Leeuw and van Zantvoort (1997) concluded that the interannual variation in the 50th percentile values was relatively small (2-7 μg.m-3 on a 50th percentile value varying between 14 and 67 μg.m-3) in comparison to the variation in the 98th percentile values (variation of 11-18 μg.m-3 for 98th percentile values ranging from 76 to 145 μg.m-3). In north west Europe peak concentrations in ozone, are reflected by the 98th percentile values, show a strong correlation with high temperatures, low wind-speed and anticyclonic conditions. Due to the considerable interannual variability in the occurrence of these conditions in north-west Europe the 98th percentile values also show a large year-to-year variation.
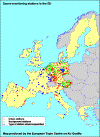
Figure 9: Location of monitoring sites from which the data were reported for 1995 in the framework of the Ozone Directive. Source: de Leeuw and van Zantvoort, 1996
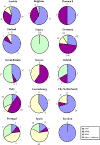
Figure 10: Classification of rural, urban, street or other/unspecified stations in each Member State as reported for 1995
Table 6: Range in 50-, 98- and 99.9-percentile values and maximum measured concentrations (based on 1-h average) observed at individual monitoring stations in Member States (μg.m-3) in 1994, 1995 and 1996 (na = no information available; ? = data not submitted)
| Statistic |
Member
State |
1994
min max
|
1995
min max
|
1996
min max
|
| 1h-P50 |
AT
BE
DE
DK
ES
FI
FR
GB
GR
IE
IT
LU
NL
PT
SE |
9
12
?
50
7
29
?
14
21
52
5
18
16
6
55 |
93
52
?
63
74
73
?
74
60
58
61
62
50
86
69 |
9
27
9
45
11
34
13
14
18
48
7
16
17
10
57 |
96
50
92
63
78
70
81
68
59
72
69
62
53
90
67 |
13
22
9
45
11
33
na
12
20
47
14
14
15
7
59 |
100
49
94
59
90
74
na
68
62
72
74
61
46
94
69 |
| 1h-P98 |
AT
BE
DE
DK
ES
FI
FR
GB
GR
IE
IT
LU
NL
PT
SE |
102
87
?
108
41
80
?
70
106
86
47
89
86
61
100 |
161
152
?
124
161
107
?
130
170
92
190
166
156
124
129 |
88
126
70
104
34
79
70
72
79
100
64
87
86
32
93 |
153
167
182
112
141
116
170
160
173
125
179
167
153
137
117 |
83
105
67
102
32
82
na
70
87
86
50
77
71
24
99 |
151
136
172
116
187
129
na
130
164
106
179
145
121
137
128 |
| 1h-P99.9* |
AT
BE
DE
DK
ES
FI
FR
GB
GR
IE
IT
LU
NL
PT
SE |
|
|
117
187
113
156
56
100
112
116
101
na
107
149
164
57
115 |
201
235
242
183
232
133
265
244
275
na
246
210
232
227
183 |
120
159
122
144
55
105
na
112
116
na
106
118
116
62
117 |
213
222
213
164
262
164
na
216
301
na
233
183
219
175
183 |
| 1h-MAX |
AT
BE
DE
DK
ES
FI
FR
GB
GR
IE
IT
LU
NL
PT
SE |
|
|
128
214
148
177
62
109
30
28
110
160
95
178
175
81
122 |
260
284
293
202
292
147
319
268
352
233
338
253
279
365
206 |
129
168
128
151
82
134
na
56
157
124
112
130
133
105
125 |
224
243
269
200
335
190
na
242
391
173
371
199
265
275
210 |
*Additional information submitted on a voluntary basis.
Table 7: Range in 50-, 98- and 99.9-percentile values and maximum measured concentrations (based on moving 8-h average) observed at individual monitoring stations in Member States (μg.m-3) in 1994, 1995 and 1996 (na = no information available; ? = statistics on 8-h average concentrations not submitted)
| Statistic |
Member
State |
1994
min max
|
1995
min max
|
1996
min max
|
| 8h-P50 |
AT
BE
DE
DK
ES
FI
FR
GB
GR
IE
IT
LU
NL
PT
SE |
14
13
?
49
10
30
?
14
24
51
8
19
18
19
? |
93
52
?
63
74
73
?
74
60
57
59
63
50
86
? |
13
27
15
45
11
34
14
16
20
47
44
19
19
10
56 |
95
55
91
63
77
70
81
68
59
71
44
62
53
91
67 |
17
23
14
45
11
34
na
?
23
47
na
17
16
14
58 |
100
49
93
59
89
74
na
?
64
73
na
61
47
93
69 |
| 8h-P98 |
AT
BE
DE
DK
ES
FI
FR
GB
GR
IE
IT
LU
NL
PT
SE |
93
80
?
103
37
73
?
70
95
85
39
79
78
60
? |
159
145
?
121
146
104
?
130
153
86
159
163
144
120
? |
81
114
62
98
31
74
65
66
72
94
146
77
79
30
90 |
148
152
177
107
138
113
155
156
155
120
146
164
140
144
114 |
77
95
59
98
27
75
na
?
80
80
na
70
65
56
99 |
149
134
169
113
178
126
na
?
148
103
na
141
111
135
125 |
| 8h-P99.9* |
AT
BE
DE
DK
ES
FI
FR
GB
GR
IE
IT
LU
NL
PT
SE |
|
|
109
168
104
139
47
91
94
102
89
na
na
131
141
54
112 |
183
219
232
168
159
131
225
238
223
na
na
200
214
205
171 |
106
147
107
126
46
99
na
?
105
na
na
102
107
95
115 |
203
192
195
161
237
159
na
?
231
na
na
169
199
159
175 |
| 8h-MAX |
AT
BE
DE
DK
ES
FI
FR
GB
GR
IE
IT
LU
NL
PT
SE |
|
|
119
184
130
164
41
99
28
24
98
145
66
146
156
61
114 |
211
251
267
189
188
137
241
252
259
190
244
205
227
226
194 |
120
145
94
134
39
111
na
?
115
117
120
119
112
55
124 |
212
228
230
177
276
164
na
?
258
155
219
179
234
169
192 |


Document Actions
Share with others