Group 5: Price signals
|
TERM indicators
|
Objectives
|
DPSIR
|
Assessment
|
|
14. Transport price (*)
|
promote public transport and rail through the price instrument
|
R
|
?
|
|
15. Fuel prices and taxes (**)
|
differentiate taxes across modes
|
D
|

|
|
19. Proportion of infrastructure
and environmental costs
(including congestion costs)
covered by price (***)
|
full recovery of environmental and accident costs
|
R
|
|
 positive trend (moving towards target)
some positive development (but insufficient to meet
target)
unfavourable trend (large distance from
target)
? quantitative data not available or
insufficient
(*) Includes TERM Indicator
18 – Expenditure for personal mobility per person by income
group.
(**) Includes ideas for future development of
the TERM Indicator 16 – Transport taxes and charges
(other than fuel taxes), which cannot currently be shown for lack of
data
(***) Includes ideas for future development
of the TERM Indicator 17 – Subsidies, which cannot
currently be shown for lack of data
Group policy context
Pricing policies can encourage behavioural
changes towards environmentally less damaging and safer forms of
transport. Prices can also influence demand and efficiency by ensuring
that users pay the full cost of transport.
- The European Commission is committed to
developing a fair and efficient Community pricing system. The
objectives are described in the Commission White Paper ‘The Future
Development of the Common Transport Policy’ (CEC, 1992) and the Green
Paper ‘Towards Fair and Efficient Pricing in Transport’ (CEC, 1995).
These argue that taxation should be used to ensure that all external
costs, such as air pollution, accidents, noise and congestion, are
covered in the prices paid by the user.
- The fair and efficient pricing policy relies
on taxes on road transport fuels (CEC, 1998a) and charges for road use
(CEC, 1998c). It also proposes that taxes and charges should be used to
differentiate prices across ‘time, space and modes’ (CEC,
1998d).
- An example of this is the ‘Eurovignette
Directive’ (CEC, 1998b), dealing with charges and taxes for heavy-goods
vehicles, and classifying heavy-goods vehicles in accordance with their
environmental impacts.
- The implementation of the fair and efficient
pricing policy, however, faces many difficulties. In the Commission’s
White Paper on ‘Fair Payment for Infrastructure Use’ (CEC, 1997b), a
phased approach to a common transport infrastructure charging framework
was proposed, but this met many obstacles.
- In its 1998-2004 work programme, the
Commission announced that it will take the necessary steps to launch
the first phase of the programme to apply progressively the principle
of charging for marginal social costs.
Group key findings
Figure 5.1: Real changes in the price
of transport, United Kingdom
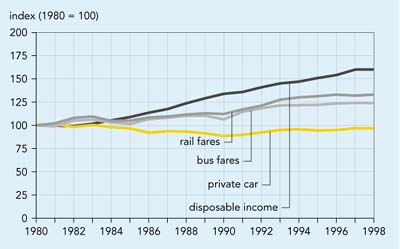
Source: Department of the Environment, Transport and
the Regions, UK (1999)
- Data from the United Kingdom and Denmark
shows that the total costs of car transport (including purchase,
maintenance, insurance, taxes and fuel use) have remained fairly
constant in real terms since the 1980s. Moreover, the perceived
marginal cost (i.e. real fuel price), which often governs decisions on
car use, has fallen in some countries. By contrast, the costs of public
transport have increased at a faster rate than those of car transport.
Changes in prices have therefore encouraged private car use rather than
public transport.
- Currently there is little consistency in
fuel price and tax policies across the EU.
- The external costs of transport in the EU
caused by environmental damage (noise, local air pollution, climate
change) and accidents are estimated at around 4 % of GDP. This
excludes the costs of infrastructure wear and tear, congestion and some
other environmental damage.
- Although methodological and data problems
remain, the current internalisation of infrastructure and environmental
costs is estimated to cover only about 30 % of external costs for
road and 39 % for rail. This shows that even when taxes are
included transport revenues still do not cover all external
costs.
- Harmonised data on taxes (apart from fuel
taxes) and other charges is not available.
- As well as considering the effects of
taxation on demand, it is important to consider the effects of
subsidies. At present, data on subsidies is not collected in a way that
enables an EU-wide indicator to be developed. Such an indicator is
needed as there are believed to be wide variations in subsidy policy
and level across the EU.

Document Actions
Share with others