Indicator 11: Access to transport services
- Access to public transport is more difficult
in non-urban areas, particularly for social groups with low car availability.
- Car ownership rates increased by a factor of
2.5 from 1970 to 1997. Together with the increase in road infrastructure,
this has made road transport access easier than other modes
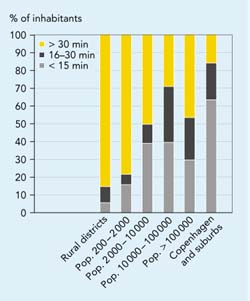
Figure 3.8: Distribution of population
within certain walking time to rail and bus services (Denmark) |
 |
|
Source: The Danish Ministry of Transport, 1997
Objective
Improve access to public transport.
Definition
- Proxy indicator: share of population within
a given distance and time from public transport nodes
- Proxy-indicator: number of cars and buses per
capita.
|
Policy and targets
Access to transport services measures the
. ease of reaching. transport facilities and is closely related to the concept
of mobility, which covers the ease of moving around using all transport modes
(including walking). Mobility also depends on individual circumstances, such
as health, disposable income, car availability and distance to public transport
or road infrastructure. This indicator is closely related to those covering
the supply of transport infrastructure (Indicator 12) and the size of the vehicle
fleet (Indicator 25).
Improving access to transport infrastructure is a CTP
goal. It is one of the policies being implemented through the TEN programme,
which aims to improve access to multi-modal networks and improve the inter-linking
of modes. The Citizens. Network (CEC, 1995) proposes ways of promoting public
transport. However, no specific EU targets have been established for this indicator
and few Member States have set any.
The Netherlands has, however, targeted that, by 2010,
improved public transport links will enable 50-100 % more peak-hour passengers
to be carried on main corridors than in 1986.
Findings
Access to public transport is a key factor in measuring
access to transport services in general. Data is not available at the EU level,
so this analysis draws on a limited number of Member State examples.
Data from Denmark shows public transport accessibility
for various types of urban area. Figure 3.8 illustrates the distribution of
the population with respect to walking time to the nearest train station or
bus stop, and shows the much higher access times in non-urban areas. This is
a particular problem for social groups with low car availability, and the problem
becomes worse when public transport service frequency is taken into account.
The trend in car ownership rates provides a proxy indicator
for accessibility to car transport. In the EU, the car ownership trend shows
how access to road transport has increased dramatically, although geographic
differences are still large.
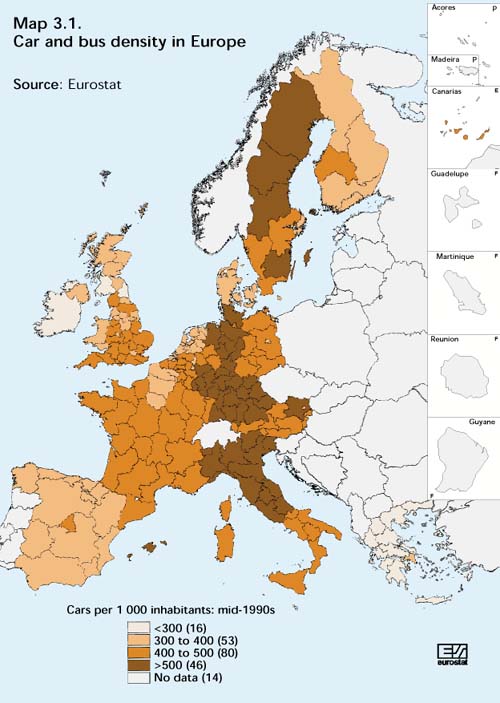
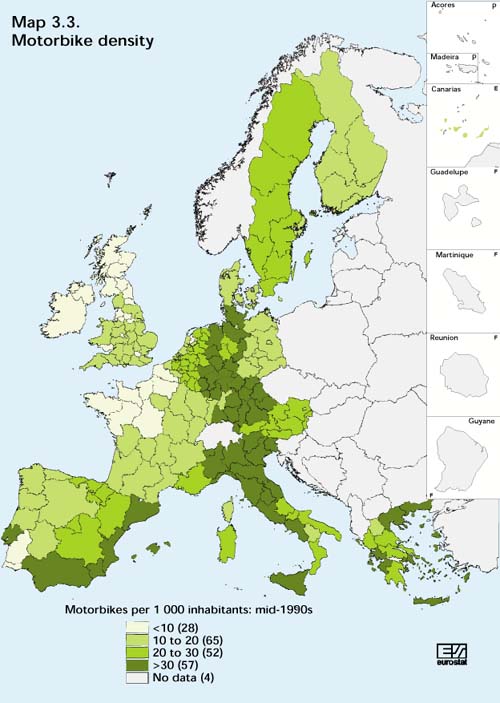
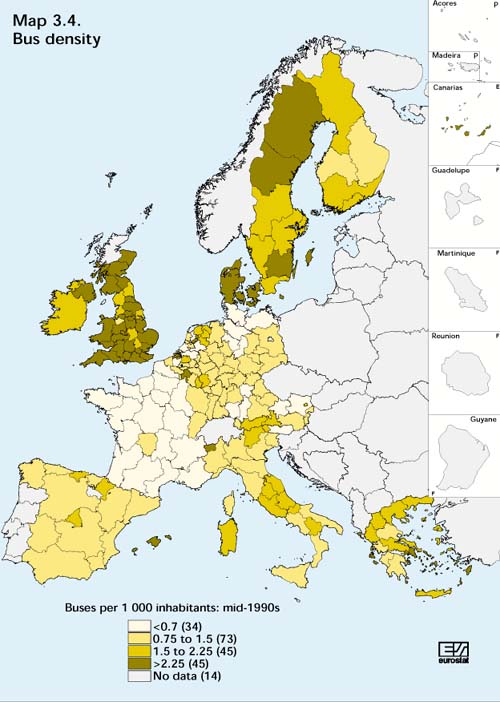
The density maps below show that the former West Germany,
northern parts of Italy and large parts of Sweden have the highest car ownership
rates . more than 500 per 1 000 inhabitants. Former West Germany, large
parts of Italy and some parts of Spain also have a high density of motorbikes.
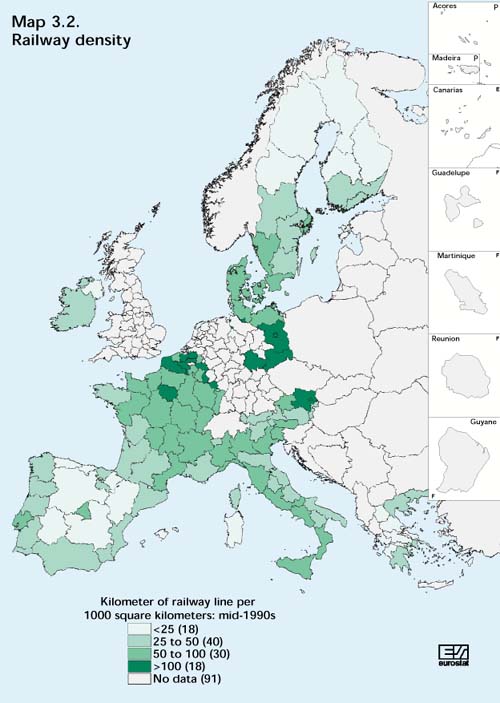
The UK, Denmark and Sweden have the highest densities of buses. Railway data
is not available for Germany and the UK, but does show a high rail density in
the former East Germany.
Another proxy indicator for the degree of individual
mobility is the share of households without a car. In 1994 this ranged from
17 % in Luxembourg through 42 % in Denmark and the Netherlands to
45 % in Greece and Portugal, with an EU average of 28 % (and decreasing).
Non-car ownership rates may vary significantly within
social groups and with geographic location. Danish data shows that non-car ownership
rates are higher than average in the city of Copenhagen, and that the rates
are much lower for single-parent households than for couples and also much lower
for low-income groups than for high-income groups. A UK survey showed that households
without a car find access to key amenities more difficult than those with a
car (see Figure 3.9)
Figure 3.9: Car ownership and access to basic services,
United Kingdom, 1997/98
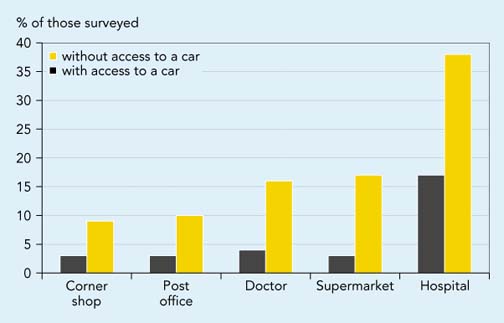
Source: Department of the Environment, Transport and the Regions (United
Kingdom, 1996)
Map 3.1: Car density in Europe
Map 3.2: Railway density in Europe
Map 3.3: Motorbike density in Europe
Map 3.4: Bus density in Europe
Future work
- EU data on public-transport access needs to be improved.
It should show the distribution of population against distance and walking
time to public transport nodes, together with service frequency and possibly
the type of destination served. It should also show how public transport is
accessed (e.g. the modes used to travel to and from airports, rail and bus
stations).
- EU data on car access should show the distribution
of population against time and distance to the main road network.
- Car ownership data should include a breakdown by
social group. This would need careful classification of social groups.
Data
| Number
of passenger cars
UNIT: cars per 1000 inhabitants
|
| |
1970
|
1980
|
1990
|
1991
|
1992
|
1993
|
1994
|
1995
|
1996
|
1997
|
|
Austria
|
160
|
298
|
388
|
397
|
412
|
422
|
433
|
447
|
458
|
469
|
|
Belgium
|
214
|
321
|
388
|
397
|
400
|
409
|
423
|
428
|
435
|
442
|
|
Denmark
|
218
|
271
|
309
|
307
|
310
|
312
|
312
|
321
|
329
|
340
|
|
Finland
|
155
|
256
|
389
|
385
|
384
|
371
|
368
|
372
|
379
|
378
|
|
France
|
234
|
341
|
466
|
474
|
476
|
478
|
478
|
477
|
477
|
478
|
|
Germany
|
194
|
330
|
447
|
460
|
471
|
479
|
488
|
495
|
500
|
505
|
|
Greece
|
26
|
89
|
171
|
173
|
177
|
188
|
199
|
211
|
223
|
229
|
|
Ireland
|
137
|
218
|
225
|
237
|
242
|
252
|
265
|
280
|
291
|
313
|
|
Italy
|
189
|
313
|
483
|
501
|
518
|
520
|
540
|
553
|
571
|
577
|
|
Luxembourg
|
212
|
352
|
480
|
496
|
513
|
523
|
540
|
559
|
559
|
573
|
|
Netherlands
|
197
|
322
|
368
|
368
|
373
|
376
|
383
|
364
|
370
|
372
|
|
Portugal
|
49
|
94
|
187
|
203
|
205
|
224
|
242
|
258
|
277
|
297
|
|
Spain
|
70
|
202
|
308
|
321
|
335
|
343
|
351
|
362
|
376
|
390
|
|
Sweden
|
284
|
347
|
421
|
421
|
414
|
410
|
409
|
411
|
413
|
419
|
|
United Kingdom
|
214
|
277
|
361
|
360
|
360
|
367
|
372
|
374
|
388
|
398
|
|
EU15
|
184
|
291
|
401
|
410
|
418
|
423
|
432
|
437
|
447
|
454
|
Source: Eurostat
Households without a car, 1994
|
Country
|
B
|
DK
|
D
|
EL
|
E
|
F
|
IRL
|
I
|
L
|
NL
|
A
|
P
|
FIN
|
S
|
UK
|
EU15
|
|
% households without a car
|
24%
|
42%
|
26%
|
45%
|
32%
|
22%
|
34%
|
22%
|
17%
|
42%
|
35%
|
45%
|
36%
|
27%
|
30%
|
28%
|
|
of which % who cannot afford a car
|
7%
|
16%
|
5%
|
24%
|
16%
|
7%
|
18%
|
4%
|
4%
|
7%
|
n.a.
|
28%
|
n.a.
|
n.a.
|
11%
|
9%
|
Source: Eurostat, DG Transport.
Note: Data for Sweden refer to 1997

Document Actions
Share with others