Indicator 8: Passenger transport
|
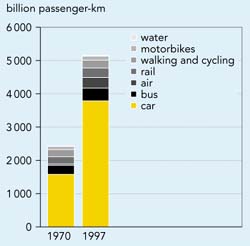
Total passenger-km travelled in the EU increased
by 112 % during 1970-1997. This represents an average annual growth
rate of 2.8 %, which outstrips that of GDP (2.5 % per year
over the same period). The share of car transport increased from 65 %
to 73 % during the period, and total car passenger-km rose by 140
%. Aviation is the fastest growing mode; its current market share
(6 %) is greater than rail (5 %).
Figure 2.2: Annual passenger transport performance
by mode (EU)
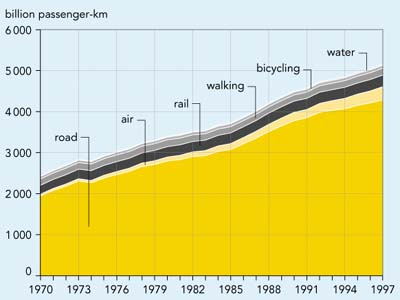
Sources:
DG Transport, Eurostat
Objectives
- Reduce the link between economic growth and passenger transport demand.
- Improve the shares of public transport, rail, inland waterways, walking
and cycling modes.
Definition
Passenger-km travelled by mode of transport.
Note: Dividing this indicator by the population, or adjusting
by GDP provides two possible measures of transport intensity km per
head, and passenger-km relative to GDP. These indicators can show progress
in reducing the coupling between economic activity and transport demand.
|
Policy and targets
Several strategies are being developed under the CTP
to shift modal choice towards environment-friendly modes. The TEN implementation
(see Group 4) aims at improving the intermodality of the transport system and
the modal balance. The development of high-speed rail is one of the main elements
of the Strategy for Revitalising the Communitys Railways (CEC, 1996, and
is in particular expected to counter the decline of rail passenger transport.
The setting of fairer prices may also encourage the use of rail or public transport.
At the urban level, public transport is being promoted through the Citizens
Network campaign (CEC, 1995).
Quantified EU targets for modal shares are still lacking.
Several countries, however, have national targets. For instance, the Netherlands
has a 2010 target of reducing car vehicle-km by 10 % (from the 1986 level)
by shifting demand from private to public passenger transport. The aim is to
have an integrated system of public transport services that by 2010 is capable
of carrying 50-100 % more peak-hour passengers than in 1986. The United
Kingdom aims to double (from 1996) the use of bicycles by 2002, and double it
again by 2012.
Findings
Figure 2.3: Changes in passenger transport modal
split (European Union)
Sources: DG Transport, Eurostat
Total passenger-km travelled in the
EU have more than doubled over the period 1970-1997. The average growth rate
of 2.8 % per year is even higher than the average growth in GDP over the
same period (2.5 % per year). The growth was highest in Greece, Portugal
and Spain, where passenger transport demand has more than quadrupled. The three
Member States with the lowest growth in the period were Sweden, Denmark and
Belgium.
The total number of passenger-km per
capita has been increasing steadily since 1970 reflecting the increasing demand
for mobility. The average person in the EU, travels 10 000 km by car per
year, ranging from 12 500 km in Denmark and Ireland to 6 000 km in Greece
(1997). Car ownership growth, which is strongly correlated with GDP growth,
is one of the most important factors. Car ownership increased from 184 to 454
per 1 000 inhabitants between 1970 and 1997 (see Indicator 25).
Passenger car transport is the mode
most used: over the period from 1970 to 1997 its share rose from 65 to 74 %
and total passenger car-km rose by 140 %. With a current market share
of 6 % (compared with 2 % in 1970), air transport has become the
third most important means of transport, after passenger cars and buses (8 %
in 1997). The declining share of rail (from 9 % in 1970 to 5 % in
1997), walking and cycling challenges the Communitys key priority of promoting
and advancing more sustainable forms of transport. See Box 2.1.
Growth rates for the different modes
of transport vary substantially. The fastest growing mode is air (7.7 %
per year), and next, car (3.3 % per year). The more environmentally friendly
modes have the slowest growth rates: cycling (0.5 % per year), rail (1.0
% per year) and bus (1.3 % per year).
The current trends towards increased
road and aviation use are expected to continue. The recent EEA outlooks report
showed that under a business-as-usual scenario passenger transport would grow
by 30 % by 2010 compared with 1995 (EEA, 1999).
|
Box 2.1: Cycling in the EU
Not all means of transport have adverse environmental effects. Cycling
does not lead to noise and congestion nor does it contribute to air pollution.
The bicycle makes effective use of human power and natural resources,
and the physical activity of cycling is healthful.
Use of the bicycle in EU has stabilised over recent decades at about
185 km/person per year. However, in Denmark and the Netherlands the levels
are significantly higher (about 900 km and 850 km respectively), which
contradicts the hypothesis that high use of cycling is associated with
low purchasing power of individual households. In fact, countries with
high levels of bicycle use also tend to have high GNP.
Promotion of bicycles as a means of transport has great potential. In
Europe today nearly half of private car trips are shorter than 6 km
for which the bicycle is (in urban traffic) often quicker than the car.
Source: DG Transport fact sheet Bicycle Transport, November 1997 and
European Local Transport Information Service
|
Future work
Further work is needed to develop reliable and comparable
statistics on passenger-km. The results described here should be taken as a
preliminary indication of the trends at the EU level which will need to be more
carefully researched.
|
Data
Passenger transport demand
Unit: bn passenger-km
|
|
|
1970
|
1980
|
1990
|
1992
|
1993
|
1994
|
1995
|
1996
|
1997
|
|
Austria
|
48.4
|
65.2
|
79.8
|
88.4
|
87.7
|
88.4
|
88.4
|
88.1
|
87.8
|
|
Belgium
|
66.1
|
81.4
|
98.1
|
102.9
|
105.1
|
108.1
|
110.4
|
110.6
|
112.9
|
|
Denmark
|
41.5
|
49.9
|
68.1
|
70.7
|
71.4
|
73.7
|
76.6
|
79.8
|
81.9
|
|
Finland
|
32.9
|
45.6
|
63.0
|
61.6
|
60.7
|
60.6
|
61.2
|
61.7
|
62.9
|
|
France
|
370.9
|
543.2
|
691.1
|
721.7
|
734.8
|
752.5
|
760.6
|
775.4
|
788.9
|
|
Germany
|
519.2
|
666.7
|
818.3
|
846.6
|
858.7
|
851.7
|
862.5
|
863.7
|
872.5
|
|
Greece
|
19.6
|
44.7
|
68.5
|
71.2
|
74.1
|
77.0
|
80.6
|
83.9
|
87.0
|
|
Ireland
|
19.4
|
33.4
|
41.4
|
44.2
|
45.8
|
47.5
|
48.8
|
50.4
|
51.9
|
|
Italy
|
278.8
|
424.8
|
654.9
|
741.1
|
734.4
|
731.3
|
752.8
|
758.6
|
773.4
|
|
Luxembourg
|
2.6
|
3.2
|
4.6
|
5.0
|
5.2
|
5.3
|
5.4
|
5.4
|
5.5
|
|
Netherlands
|
85.4
|
129.2
|
160.3
|
168.0
|
169.4
|
175.2
|
175.3
|
174.4
|
180.1
|
|
Portugal
|
25.4
|
54.7
|
81.0
|
88.7
|
100.1
|
107.7
|
117.4
|
123.0
|
126.7
|
|
Spain
|
100.3
|
231.8
|
332.1
|
358.3
|
365.4
|
372.9
|
384.5
|
393.3
|
411.3
|
|
Sweden
|
65.5
|
81.0
|
105.0
|
106.4
|
105.8
|
99.1
|
102.0
|
108.4
|
109.3
|
|
United Kingdom
|
394.1
|
478.4
|
679.6
|
670.1
|
671.0
|
677.0
|
683.5
|
698.6
|
710.1
|
|
EU15 main (road and rail)
|
2069.8
|
2933.3
|
3945.6
|
4144.8
|
4189.6
|
4227.9
|
4309.9
|
4375.3
|
4462.1
|
|
EU15 total
|
2431.9
|
3397.2
|
4502.5
|
4723.8
|
4787.8
|
4850.5
|
4956.2
|
5042.4
|
5154.0
|
| Source:
Eurostat, DG Transport |
|
Average annual car-passenger transport per capita
Unit: 1 000 passenger-km/capita
|
| |
1980
|
1990
|
1992
|
1993
|
1994
|
1995
|
1996
|
1997
|
|
Austria
|
6.3
|
8.1
|
8.8
|
8.5
|
8.5
|
8.5
|
8.2
|
8.3
|
|
Belgium
|
6.6
|
8.1
|
8.4
|
8.6
|
8.8
|
9.0
|
9.1
|
9.2
|
|
Denmark
|
7.4
|
10.4
|
10.9
|
11.1
|
11.4
|
11.7
|
12.1
|
12.4
|
|
Finland
|
7.1
|
10.3
|
10.0
|
9.8
|
9.7
|
9.8
|
9.8
|
10.0
|
|
France
|
8.4
|
10.3
|
10.8
|
11.0
|
11.2
|
11.4
|
11.6
|
11.7
|
|
Germany
|
6.6
|
8.6
|
8.9
|
9.0
|
8.9
|
8.9
|
8.9
|
9.0
|
|
Greece
|
2.9
|
4.8
|
4.9
|
5.2
|
5.4
|
5.6
|
5.9
|
6.1
|
|
Ireland
|
8.2
|
10.4
|
10.9
|
11.2
|
11.5
|
11.8
|
12.1
|
12.5
|
|
Italy
|
5.7
|
9.2
|
10.6
|
10.6
|
10.5
|
10.7
|
10.8
|
11.0
|
|
Luxembourg
|
7.4
|
10.5
|
11.0
|
11.3
|
11.4
|
11.5
|
11.3
|
11.5
|
|
Netherlands
|
7.6
|
9.1
|
9.1
|
9.2
|
9.5
|
9.5
|
9.4
|
9.7
|
|
Portugal
|
4.2
|
6.6
|
7.3
|
8.4
|
9.1
|
10.0
|
10.6
|
11.0
|
|
Spain
|
5.1
|
7.3
|
7.8
|
8.0
|
8.1
|
8.4
|
8.6
|
8.9
|
|
Sweden
|
8.0
|
10.5
|
10.6
|
10.4
|
9.6
|
9.9
|
10.5
|
10.6
|
|
UK
|
7.0
|
10.4
|
10.3
|
10.2
|
10.3
|
10.4
|
10.6
|
10.7
|
|
EU
|
6.6
|
9.1
|
9.5
|
9.6
|
9.7
|
9.8
|
9.9
|
10.1
|
|
Source: Eurostat, DG Transport
Note: The data used in these analyses has been drawn from the
DG Transport statistics pocketbook (version 1999). This combines data
from Eurostat, the European Conference of Ministers of Transport (ECMT),
and other sources, together with additional data supplied by the Member
States.
|

Document Actions
Share with others