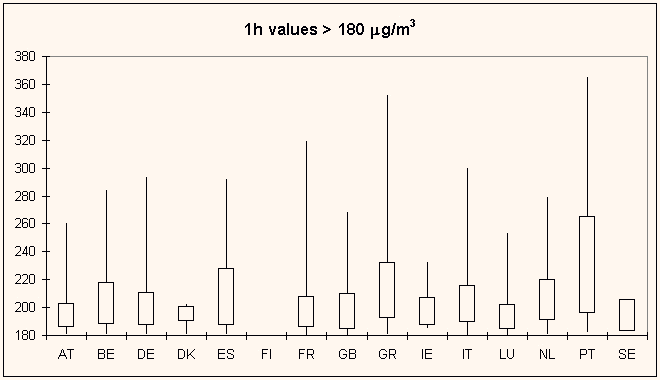
Frequency Distribution of Ozone
Concentrations
| |
AT |
BE |
DE |
DK |
ES |
FI |
FR |
GB |
GR |
IE |
IT |
LU |
NL |
PT |
SE |
| #ex |
128 |
211 |
1804 |
6 |
40 |
0 |
374 |
99 |
185 |
13 |
295 |
43 |
257 |
18 |
2 |
| #st |
110 |
20 |
342 |
6 |
86 |
11 |
110 |
30 |
10 |
6 |
54 |
5 |
37 |
8 |
6 |
|

Figure 6. Frequency distribution of ozone concentrations
(hourly values) in excess of the 180 µg/m3 threshold
for hourly values. For each country the total number of observed
exceedances is given in row '#Ex', the number of stations is
given in row '#St'. Frequency distributions are presented as
Box-Jenkins plots indicating the minimum, the 25-Percentile, the
75-percentile and the maximum value.


Document Actions
Share with others