3. Environmental space and indicator systems
Good policy making depends on good information - about where the problems are, about
their magnitude, their causes and the success or otherwise of present policies in dealing
with them. Policy making aimed at compliance with environmental space will be no
exception.
Indicator systems are one method of making relevant information available and
digestible to policy makers. In this chapter, we shall ask what kinds of indicators the
environmental space concept calls for - be they "new" indicators or established
ones, where there may still be a need to improve the quality of data or extend coverage to
more countries.
3.1. Background
3.1.1 Environmental indicator systems
Over the past two decades, and not least in the past few years, many international
agencies and national governments have developed sets of environmental indicators. These
naturally tend to reflect what have been priority areas for environmental policy making.
Partly, this is a matter of choice. Partly, it is a simple consequence of the fact that
most data have been generated in the areas on which most public and political interest has
been focused.
Thus, existing indicator systems generally give a considerable amount of information on
the outputs of the human economy into the environment: emissions to air and water,
noise, generation of solid waste and hazardous substances - along with some on
environmental aspects of agriculture and forestry, on protected areas and species status.
As for the input side - resource consumption - most environmental indicator sets
include information on energy consumption and on land used for agriculture. Some also
include water use and/or built-up land, but the usefulness of such information in
reporting at the international level is limited by major gaps in the availability and the
very variable quality of data. And consumption of materials is generally very scantily
covered, if at all.
The most influential exercise in environmental indicating at the international level so
far has been the "Core Set" of indicators developed by the OECD (OECD 1994). The
"Core Set" includes 72 indicators in all, although only 30 are yet operational .
They are classified in two ways: according to the issues to which they relate, and
as indicators of either "pressures", "states" or
"responses". We shall return to the latter concepts in the next section.
The list of issues used by the OECD is strongly output-oriented. It does include three
kinds of "resources" in its own terminology (water, forests and fish); but the
indicators proposed for these relate to extraction, not to OECD countries' consumption
of resources. Among the 72 indicators, there are also three on aspects of energy
consumption, of which two are motivated by the issue of climate change. But there are none
at all on materials consumption, excepting fertilisers. Although the issues of
biodiversity and soil degradation give rise to indicators on aspects of land use, there
are none on the expansion of built-up land, nor on the appropriation of foreign land by
OECD countries.
In connection with the review of the 5th EU Environmental Action Programme (5EAP), the
EEA has developed its own set of indicators (Environment in the European Union; EEA 1995).
Like the Core Set, the 84-indicator system of the EEA has the emphasis very much on
outputs. It does, however, include one very simple indicator of minerals consumption, in
adddition to some on energy, land use and water. (Perhaps significantly, there is also one
indicator showing the EU share in world population, energy and minerals
con-sumption. Still, this a long way from presenting consumption targets based on
global equity.)
Also at the EU level, EUROSTAT is currently coordinating work on the construction of an
"Environmental Pressure Index" (Jesinghaus 1995). This will be aggregated from
indicators within 10 identified "problem areas", of which "resource
depletion" has been recognised as one. However, the specific indicators in this area
have yet to be identified. Whether or not they should provide good links to the
environmental space concept, it is clear that the EPI as such, involving as it will a
complex mix of inputs and (mainly) outputs, will not be an adequate measure of compliance
with environmental space.
3.1.2 Indicators of sustainable development
Since UNCED-92, several proposals have been advanced at the international level for
more comprehensive sets of "sustainability" or "sustainable
development" indicators, as opposed to environ-mental indicators in the narrower
sense. Two of the more important ones are the set adopted by the Policy Department of the
UN Commission on Sustainable Development (DPCSD) and the "Indicators for Action"
proposed by the World Wide Fund for Nature in co-operation with the New Economics
Foundation (WWF/NEF 1994). The main difference between such systems and the straight
environmental indicator sets is of course the inclusion of a large number of indicators of
human development and welfare.
One might, however, expect "sustainable development" indicators to highlight
the equity aspect of resource consumption. Both the DPCSD and the WWF/NEF indicators
include energy and water con-sumption, while the latter also include timber consumption
and the former an economic indicator of "intensity of materials use". Apart from
this, both include some indicators on the depletion or extraction of resources
(fish, minerals, timber also in the DPCSD set). Still, there is much to be desired in the
coverage of resource consumption, which is the interesting quantity in the
environmental space context. Clearly, the selec-tion of indicators in cases such as these
is strongly influenced by concerns of data availability. These are more pres-sing at the
global than at the EU level.
3.1.3 More resource indicators needed - not to the exclusion of others
The search for improved indicators of human, social and economic development remains
extremely important. So is the maintenance and improvement of systems for reporting on
emissions, waste, disturbance and other negative outputs to the environment, including
those of mainly local or regional significance.
Our object here, however, is specifically to consider what indicators are needed to
monitor and to further progress towards compliance with environmental space. In this area,
it is clear that there are significant gaps in all of the indicator sets mentioned above,
as there are in systems used for reporting at the national level.
Not only are important resource inputs omitted altogether from existing (operational or
proposed) indicator sets. Where they are operational, the quality and/or coverage of data
on such inputs is often poor. Where reliable data do exist, they are as yet in no case
related to concepts of environmental space as such, i.e. to targets for
resource consumption. Nor do existing indicator systems give sufficient information on the
causes of trends in resource consumption.
3.2 What to measure? - Resource consumption, driving and braking forces
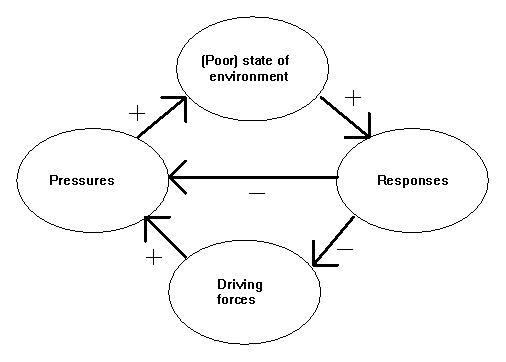
In the field of environmental reporting, a three-way classification of indicators has
gained wide acceptance. This is the PSR (pressure-state-response) system used by the OECD,
in which "pressures" may for instance be polluting emissions, "state"
may be air or water quality, and "response" may be expenditure on cleaning
measures. Ideally, the PSR system may be regarded as a chain of causal links: increased
pressures put the environment in a poorer state, which (hopefully) provokes responses,
that in turn lessen the pressures and turn the vicious circle into a good one.
However, the real world - as illustrated by the OECD's own Core Set of indicators,
actually involves consider-ably more complex chains (or webs) of causation.
"Pressure" indicators in the OECD system can cover several links in such
chains: e.g., not only urban air emissions, but also road traffic volumes; not only
nitrogen emissions to water but also fertiliser applications and even agricultural
production.
The concept of "response" indicators is also a complex one. In the OECD
terminology, it not only covers direct indicators of government action (e.g. public
expenditure on the environment or energy taxes) but also actions and even attitudes of
business and households. Then there are indirect "response" indicators
(showing results of actions which may involve all three actors - e.g. recycling
rates).
Recently, the term "driving forces" has been increasingly applied in
indicator sy-stems, in at least two quite different senses. In the DPCSD system, the
expression "driving forces" subsumes "pressures", but also
covers a range of basic socio-economic indicators. So instead of a PSR there is a D(riving
force)SR system, but without any notion of a causal link between "driving
forces" and "states".
In the EEA indicator system, on the other hand, driving forces are recognised as
distinct from "pressures". Here, "driving forces" refer to economic
and other societal developments - including some aspects of resource consumption as
such - which may contribute to "pressures" in the sense of emissions,
disturbance and so on.
The figure below is a simplified illustration of the relationships between driving
forces (in sense no. 2), pressures, state and responses. Ideally, responses should lead to
reduced pressures, either directly (if the responses are of the
"end-of-pipe" kind) or indirectly, by dampening the driving forces.
We noted that present indicator systems tend to subsume resource consumption either
among the "pressures" or among the societal "driving forces". In the
light of environmental space, however, there are good grounds for regarding it as a
separate link in the chain(s) of causation.
It is an essential part of the environmental space concept that excessive resource
consumption is a problem in itself. This is partly because of the present
environmental pressures to which it inevitably leads, but also because of its
negative implications for global equity and for future generations. Therefore, a reporting
system based on this concept will logically need to focus on resource consumption.
Similarly, if existing reporting systems are to be adapted to take account of
environmental space, they will need to place greater emphasis on resource consumption and
the forces driving it.
We have also noted that "response" indicators may be direct or indirect,
purely political or not. Indirect indicators of response may also be seen as
belonging to the same level of causation as what we have called "driving
forces".
For instance, increasing recycling rates may be interpreted as a "response"
leading to less (primary) materials consumption, whereas decreasing or static recycling
rates may be regarded as a "driving force" behind such consumption. Similarly,
increasing volumes of road traffic may be regarded as a driving force behind all kinds of
resource consumption, whereas declining or stabilising traffic volumes may be inter-preted
as an indirect indicator of responses to the problem. Rather than "indirect response
indicators", it therefore seems reasonable to talk of "braking" forces
along with the driving ones.
Also, in policy oriented reporting, it seems reasonable to distinguish between explicit
policy responses on the one hand, and broader societal developments that affect
driving or braking forces on the other.
Figure 2 and 3 illustrates the relationships outlined above.
Figure 2
Broadly, we may say that existing environmental reporting systems tend to e biased
towards the upper right-hand portion of the diagram (with some exceptions as exemplified
in the previous section). There is a corresponding need to improve reporting on the links
in the lower left-hand part. We shall consider these in turn (as well as some possible
indicators of policy response) in sections 3.5-3.9. Before doing so, we shall briefly
consider some requirements for a good indicator system.
Figure 3
3.3 Performance indicators, background indicators and targets
Indicators may be used to measure whether things (in our case meaning resource
consumption) are moving in the right or wrong direction, and at what speed. In this case,
we may call them performance indicators.
They may also be used to indicate the causes of these movements, which are of
particular interest if things are moving in the wrong direction, or too slowly in the
right direction. If so, action is called for, and we need to know what actions are likely
to be effective. We may also want indicators to compare the strength of actions that are
already being taken, especially across countries. We shall call the latter kinds of
indicators "background" indicators.
If indicators are to serve as an effective guide on the way to compliance with
environmental space, it is essential that some of them, namely the performance indicators,
should be linked to quantified targets. Without such targets, it may
be possible to say whether things are moving in the right or wrong direction. But it will
never be possible to say whether things are moving fast enough in the right
direction.
In most present international environmental reporting systems, targets are
conspicuously absent. This is not surprising, since there are few universally accepted
environmental goals. At the EU level, the 5EAP does include reduction goals for emissions
of some major pollutants, and the EEA's recent "Environment in Europe" report
does present emissions indicators together with target values. Some national-level State
of the Environment reports also present developments in emissions together with verbal and
or/graphical references to national reduction goals. Targets for resource consumption,
however, are extremely rare.
The very concept of environmental space implies quantitative targets for resource
consumption. As we saw in Chapter 1, the TSE study has proposed such a set of targets at
the EU level. National Friends of the Earth groups and research institutes have since
carried out studies to clarify the implications of these targets for individual countries
in Europe.
Policy-makers will no doubt wish to have further assessments carried out before either
accepting the targets set in TSE or setting others. Lengthy discussions on precise targets
for all resources should not, however, be allowed to delay the upgrading of reporting on
resource consumption, nor action to reduce it. If necessary, indicators can, to begin
with, be linked to targets which are explicitly defined as preliminary and indicative.
It is worth noting that TSE, for instance, suggests that one-quarter of the necessary
reductions in resource con-sumption should be achieved by 2010. If environmental space for
a given resource were taken to be 10% of present consumption (meaning that a 90% reduction
is ultimately necessary) then the necessary reduction by 2010 would be 22.5%. If
environmental space instead were 20% of present consumption, then the recommended
reduction by 2010 would be 20%. This is hardly a dramatic difference. In other words,
setting preliminary goals for the intermediate term should provide time enough for further
study and political discussion of the long-term goals - without any danger of radically
over- or undershooting the mark in the meantime.
3.4 How many indicators - for whom?
The purpose of indicators, as described in the Dobris
Assessment (Stanners and Bourdeau 1995) is to "convert data into
information" - i.e. into information digestible by policy makers (and, at best, by
the ultimate policy makers in a true democracy - the general public). However, the
distinction between "information" and "data" can hardly be made
precise. One man's set of informative indicators, giving a concise and understandable
overview of developments, may contain a great deal of what another would regard as data
incomprehensible without further interpretation.
In the present paper, we are concerned with indicators at two levels. The first is that
of indicators suitable for reporting directed at all policy makers,
including the general public. Taken together, these indicators should be capable of giving
an "at-a-glance" impression of the progress being made towards sustainable
resource consumption. The number of such "key" indicators should be no more than
10 or so, and they should belong to the performance indicators.
The second level is that represented by indicator sets such as those discussed in
section 3.1, or used in national State of the Environment reports. Here, the main will be policy makers with a special responsibility for sustainability policies,
and more interested sections of the lay public (including communicators capable of turning
the contents into information for a broader public).
Such reporting could take the shape of separate reports on resource trends, appearing
at annual or few-year intervals. It could also (and should preferably) be integrated with
existing environmental reporting systems, as well as information on social development and
equity, to form the basis for a complete system of reporting on sustainable development.
Reporting at this level should include more detailed indicators of resource consumption
trends as well as background indicators (of causes etc.). Nevertheless, the number of such
indicators should be in the tens and not in the hundreds.
Even the latter requirement means that the mass of potentially relevant data must be
radically condensed. There are two ways of doing this: by selection or by aggregation.
Either method means that information gets lost. Selection means that many elements are
left out entirely; aggregation gives an overall picture which may be more or less
meaningful, but means that no information is conveyed on any individual element. We shall
in fact suggest a combination of the two.
3.5 Performance indicators - Resource consumption
In sections 3.1 and 3.2, we discussed the need to improve reporting on resource
consumption. In reporting specifically on progress towards compliance with environmental
space, indicators of overall resource consumption as such will be those of the first order
- the "performance" indicators, which should be linked to targets, as discussed
in section 3.3. This section discusses the choice of such indicators, and of key
indicators in particular.
If these indicators are to be incorporated into broader environmental indicator
systems, there will also be indicators on the output side, which it is not, however, our
task to consider here.
In accordance with the discussion in Chapter 1, indicators of resource consumption
should cover land, materials, energy, water and marine resources. We shall consider these
in turn.
3.5.1 Land
"Consumption" of land in our context covers several things:
- The expansion of built-up area, which can be directly measured.
- The absolute extent of land that is subject to exploitation by agriculture, forestry or
other economic activities. This is close to 100% in most EU countries today and can best
be measured "negatively", as the percentage of land strictly protected from such
exploitation (i.e. in IUCN categories I-II).
- The overintensive exploitation of land that is used for agriculture and forestry.
The pertinent indicators in this case will depend on one's view of the limits to
sustainable exploitation. If one follows the reasoning in "Towards Sustainable
Europe", for instance, then the percentage of land that is organically farmed will
be a natural indicator of progress towards sustainability in agriculture, while an
indicator of sustainable forestry might be the percentage of forest area that is naturally
regenerated. Other possible indicators - in the case of agriculture - could for instance
be the percentage of gross area not devoted to crops, or rates of soil erosion. The latter
would, however, be more difficult to operationalise. If one believes that integrated
farming is an acceptable approach to sustainable land management, along with organic
farming, then the percentage of land managed on either set of principles might be a
relevant indicator. The practical problem is that there are as yet no certification
procedures or recognised codes of conduct for integrated farming.
- The amount of land "consumed" through our own consumption of agricultural
products. The pertinent indicator of this will again depend on one's view of what is
acceptable. If the goal is continental selfsufficiency, then the most relevant indicator for
Europe as a whole will be the net appropriation of land in other continents to
produce for European consumption (1). This can be estimated by dividing European
imports of agricultural products from other continents by estimated average yield figures
per hectare, and subtracting European exports to other continents, divided by European
yield figures. (In the case of imports/exports of animal foods, processed foods and
finished goods made from agricultural products, such as cotton garments, conversion
figures to raw crop equivalent will be needed).
If, on the other hand, the goal is that per capita land "consumption" in
Europe should not exceed the average availability at the global level, then the ratio
between the former and the latter (2) may be a more relevant indicator.
Naturally, either of these indicators would be subject to the criticism that not all
agricultural land is of equal quality. This is especially true if one includes
pasture in the concept: enormous tracts of "permanent pasture" in other
continents have a productivity very close to nil. But even if one based the indicator on
arable land only, average productivity in Europe (at least excluding Russia) would be
somewhat better than the world average, while the hectares used for export production in
Europe might be of either better or worse quality than the hectares Europe indirectly
"imports".
Despite this, either of the indicators suggested would give important directional information
for the foresee-able future. This is because Europeans presently consume more and
better land than the world-average citizen, and would still be doing so if "net
appropriation" fell to zero. At least until this should occur, the desirable
trend for either indicator will be downwards. And if one's goal is an equitable global
share-out of resources, the desirable trend for indicator (2) will be downwards at
least until it attains the value 1. This might therefore be regarded as a preliminary
target.
An alternative way of comparing "consumption" of land - this time in terms of
(area x productivity) is to com-pare consumption of agricultural produce directly.
The difficulty in this case is the large number of different products. Nevertheless,
aggregate consumption of animal foods, which is what most tends to push land
consumption upwards, will be an important "background" indicator (cf. section
3.6).
Timber consumption, although grouped with material resources below, might also be
regarded as a proxy for "consumption" of forest land (in terms of area x
productivity x intensity of exploitation).
3.5.2 Materials
Consumption of materials may seem a more straightforward concept than consumption of
land, but in fact raises significant problems of definition and measurement.
Renewable and non-renewable materials
Materials include both of these categories, but they clearly raise rather different
sets of problems in the environmental space context. Aside from agricultural raw
materials, which compete directly with food production for arable land and the space for
which is therefore most dependent on that resource (3.5.1), the most important renewable
material by far is timber. Because of its central economic and, especially, environmental
importance, timber consumption should be tracked by a separate key indicator, while other
indicators are needed for non-renewable materials.
Apparent and real consumption
The second problem that individual countries (or the whole EU) have considerable
"invisible" imports and exports of resources, in the shape of finished goods. A
country's claim on environmental space should be regarded as the resource consumption
occasioned by final consumption of goods and services in that country.
However, the data that are readily available from trade statistics only encompass
imports and exports of materials in raw or semi-finished forms. Materials embodied in
imports and exports of finished products are not accounted for. Conventionally, apparent
consumption of materials is calculated by adding domestic extraction to visible imports
and subtracting visible exports. This excludes materials embodied in imports
of finished products, and at the same time includes materials embodied in exports.
It is of great importance to have indicators of the real consumption of
materials at the national and EU levels, since this is what needs to be brought into line
with environmental space. Naturally, it is not possible to calculate the exact amounts
of materials embodied in imported or exported goods. Nevertheless, it is possible to make
estimates which provide results that are considerably closer to the truth than are
apparent consumption figures. Such estimates have, for instance, been made for Norwegian
consumption of timber and iron (Statistics Norway 1984, Hille 1995) and for German
consumption of a range of materials resources (Behrens-meier and Bringezu 1995a).
Estimates of "invisible" imports and exports may either be based on value
figures in the trade statistics, combined with input-output analysis to estimate materials
"content" per ECU for each category of goods; or on tonnage figures, combined
with estimates of materials and energy expenditure per ton of product. In either case, the
estimation of specific (per ton or per ECU) resource costs of product categories is
demanding, but once carried out, the results may be regarded as valid for a few years at a
time. Between revisions, invisible import/export estimates can be updated using annual
trade statistics only as input.
While real consumption figures are of primary importance, it is still also important to
monitor apparent consumption. This is because the resource inputs to a country's industry
- even though some of them may leave again in the shape of exports (and some stay behind
in the shape of waste!) are also a necessary target for policies.
Aggregation
The third problem that arises in reporting on materials consumption in particular, is
that of aggregation. Clearly, if we are to arrive at a list of no more than ten
"key" indicators of resource consumption, then we cannot start counting
non-renewable materials one by one.
As we have seen, the TSE study proposes a sweeping solution to the problem, viz. to
aggregate all kinds of "material input", or humanly induced movement of (in this
context: solid) materials, in tons. Clearly, if one chooses to define environmental space
for materials consumption in these terms, then the relevant key indicator is total
material input.
In practice, this measure not only raises problems of principle (discussed in section
1.2.3) but also fresh problems of measurement, since many kinds of MI (overburden,
tailings, earth movement in construction activity etc.) generally go unreported. They
might nevertheless be estimated (in the case of overburden and tailings, standard
conversion factors - tons of MI per ton of useful material extracted - could be used, cf.
the case of aluminium discussed on p. ..).
The problems of estimation could be less, if one chose to define environ-mental space
not in terms of MI (materials moved) but in terms of materials actually used
to make products. However, aggregating these quantities (stone + sand + steel + lead +
salt.....) in tons would be less meaningful than measuring MI. An aggregate of
"materials used" would be entirely dominated by a few high-volume materials, in
particular aggregates (stone, sand and gravel) or, if one chose to leave these out, by
materials such as cement and steel. Metals and minerals that are used in low volumes, but
whose environmental loads nevertheless make them of major concern, would hardly affect the
sum. The MI measure compensates for this to some extent, because low-volume minerals tend
to have relatively larger rucksacks than the high-volume ones - and this is itself one
of the factors that can make their environmental loads of concern.
If, on the other hand, one believes that environmental space and therefore reduction
goals need to be defined separately for individual materials or classes of materials, then
a different approach to aggregation becomes relevant. This is to construct a composite
index of materials consumption. This could most simply be done by annually calculating
the unweighted average of percentage changes in consumption of the (say) ten to fifteen
materials judged most important.
A more refined and preferable method would be to weight the materials according to (1)
economic importance and (2) ecological criticality, as measured by the percentage
reductions in consumption required for compliance with environmental space. The basis for
weighting materials would naturally have to be periodically revised, as is the case with
price indices. The drawbacks of an index based on a double weighting procedure would be
(1) a possible loss in ease of comprehension and (2) that, being an index, the indicator
could only be used to track developments over time, not for synchronous comparisons across
countries.
Proposed indicators
As key indicators of non-renewable materials consumption, both aggregated (per capita)
material input and a composite index based on specific materials of major importance may
be found useful. These indicators should be based on real consumption (after accounting
for invisible exports and imports).
For in-depth reporting, they would of course need to be supplemented by consumption
data on individual materials, including the most important metals,
industrial minerals and building materials. Here, apparent as well as real consumption
figures would be relevant.
Timber consumption per capita should be a separate key indicator.
3.5.3 Energy
Aggregating and measuring energy consumption is rather more straightforward than is the
case with materials or land.
One may define separate "environmental spaces" for exploitation of different
energy sources at the global level. But since energy from widely different sources can be
converted into the same end-useable forms (albeit not always at 100% efficiency), and can
also be traded between countries, it is most meaningful to define the environmental space
for consumption of (primary) energy as a single aggregate, in joule. Similarly, the
first key indicator of progress towards compliance with environmental space in this field
will be total primary energy consumption per capita.
As in the case of materials, this aggregate should be estimated in real terms
(including the energy embodied in imported goods and services, but excluding the energy
content of exports). And as in the case of materials, invisible exports and imports of
energy may either be estimated by economic input-output analysis or by estimating the
energy-content-per-physical-unit of categories of imports and exports. (Such estimates
have for instance been made for Norway (Statistics Norway 1984; Hille 1995); and estimates
of "embodied" CO2 emissions resulting from fossil energy use have
been made for several major OECD countries (Wyckoff and Roop 1994).
While real energy consumption should be measured in aggregate, it is also
important to monitor progress in replacing less with more sustainable energy sources.
These are relative concepts, since all energy sources entail some environmental
costs. Nevertheless, a "key" indicator should draw the line between renewables
and non-renewables. Since countries have no influence over the sources of energy that are
used to produce the goods and services they import, the policy relevant measure in this
case is the share of renewables in total apparent energy consumption.
For in-depth reporting, these two key indicators should be supplemented with
information on trends in use of individual sources of energy (oil, coal, gas, hydro, wind,
solar etc.)
3.5.4 Water
Consumption of water also presents problems of definition, as indicated by the widely
differing ways in which it is currently reported (where it is reported at all) by national
statistical agencies. Reporting should cover consumption by all economic sectors
(agriculture and/or energy conversion are often omitted today). A greater problem of
principle is the fact that much of the ground or surface water "consumed" for
purposes other than irrigation, is in fact returned to local watercourses, in a
more or less polluted state. Nevertheless, gross abstractions are probably the best
feasible, first-order indicator of pressure on water resources. They must be related to
regional targets, which will depend on rates of runoff and aquifer recharge. Because of
this, aggregate water consumption cannot be considered as a "key" indicator at
the EU level or in most countries.
3.5.5 Marine resources
As the first priority, reporting on these should cover fish and other animal seafood.
Ideally, "consumption" in this case should refer to the total kill behind
a country's seafood consumption. However, since dumping of (especially) undersized fish is
generally unreported, the catch (in round weight equivalent) required to make the
country's consumption of seafoods (and marine feeds) possible, is probably the best
feasible indicator. This of course necessitates conversion factors for imports and exports
of processed fish products.
3.6 Background indicators (1): Driving and braking forces
3.6.1 Introduction
The forces driving or braking resource consumption (cf. fig. 2) can be decom-posed
along several dimensions. At least two of these are of central importance, if one wants to
inform policy-making aimed at compliance with environmental space.
The first is to ask how particular socio-economic sectors are contributing to
growth or the opposite in resource consumption. This is important first of all because
policy-making tends to be sectorally organised. It is important for policy-makers at the
sectoral level to know whether they are "doing their bit" towards securing
compliance with environmental space, just as it is important for those with cross-sectoral
responsibilities to be able to identify the sectors that present the greatest problems
and/or potentials.
Quite apart from the present organisation of policy-making, a sectoral break-down can
be useful because different sectors use resources in different ways, which are then
susceptible to different kinds of policy measures.
The other dimension of central importance is what we may call the volume/intensity
dimension. The re-source load of a society depends on its total income, on how that income
is disposed (across more and less resource-intensive goods and services) and on how the
goods and services are produced (with more or less resource-intensive technologies). Each
of these factors may be a target of policies, but partly different sets of policies will
be required to improve the efficiency of tech-nologies and to influence consumption
patterns. It is therefore important to track developments in each of these fields.
3.6.2 Resource consumption by sectors
Many existing environmental reporting systems already split consumption of certain
resources (most commonly energy, and sometimes water) by sectors. Built-up land is split
by sectors in the national statistics of some countries, though such sectoral breakdowns
are less often included in environmental reporting. No regular environmental reporting
systems that we know of split materials consumption by sector.
There is still a need to harmonise reporting on sectoral energy consump-tion,
and to upgrade and expand reporting on sectoral consumption of water and built-up land.
This means agreeing on which sectoral breakdowns make sense from the point of view of
policy-making aimed at reducing con-sumption, and seeing to it that corresponding
statistics are gathered.
In the case of materials, it is at once more difficult and less obviously relevant to
policy-making, to split consumption between the same kinds of sectors that may be used in
the other three cases.
Energy
For overview purposes, final energy consumption is often divided between the following
sectors:
- Primary industries
- Secondary industries
- Services
- Transport
- Households (or a "residential" sector)
In addition there is the consumption of the "energy sectors" (i.e. energy
conversion and distribution), which, together with losses, equals the difference between
primary and final energy consumption.
There are in fact good practical reasons for using the six-way split shown above
(including the energy sector), in reporting on energy consumption. This in preference to
the simpler three-way split (manufacturing/transport/other) used for instance in the
Dobris Assessment and several OECD publications, and also to breakdowns by
national-accounts sectors. The six sectors represent naturally distinct foci of attention
in shaping policies to reduce consumption, because the main uses to which energy is put
are quite different as between them. There is one major exception: both households and
services use energy mainly for heating, cooling, lighting and ventilation. But, at the
same time, households and businesses are quite different in their behaviour and with
respect to the policies that are likely to be effective.
Land
A similar categorisation makes sense with respect to (built-up) land.
Within the primary sector, however, mining and quarrying operations become significant as
consumers of land in some countries (more so than of energy) and should be separated from
agricultural construction. Also, recreational facilities (outside urban areas) are
increasingly important and should be considered separately from land used for urban
services. Finally, parks and other public open spaces within urban areas should be
separately identified.
Water
Where figures on water consumption are split by sector, this may be done (as it is in
the Dobris Assessment) in a way quite similar to that suggested for energy, except that
transport is omitted and the primary sector split between agriculture and
mining/quarrying. As in the case of energy, this makes good policy sense because of the
different ways in which the sectors (agriculture, energy conversion, manufacturing,
agriculture and services/households) use the resource.
Materials
Solid materials present a different set of problems altogether. Materials are
first extracted within the primary sector, then passed on, often through many stages,
within the secondary sector, until whatever has not become waste on the way enters into a
finished product - i.e. a product which is not to undergo further processing.
The finished product may, indeed, end up in any one of the "sectors"
suggested in the case of energy. It may be a turbine or a pylon (energy sector), plough or
pesticide (primary sector), factory or machine tool (secondary sector), cash register or
school black-board (service sector), car or bridge (transport sector), house or household
good (residential sector). Actually estimating the amounts of materials that end up in
each of these sectors - and the amounts of waste that arise on the way - is, however, a
demanding exercise, of the kind that may be carried out on a project basis but hardly in
connection with regular reporting.
More importantly, there is no obvious reason why there should be different sets of
policies directed at construction of houses, of offices and of factories, or
why the production of tractors and ploughs should be the target of one set of
policies, distinct from those directed at production of paper machines and lathes. Nor is
there any way of differentiating between production of PCs destined for factories, schools
and homes.
Rather, there are - at the first level - two obvious target groups for policies aimed
at reducing materials consumption. The first is the secondary industries in their role of
producers. The second is the purchasers of finished products. It is impossible to
apportion materials con-sumption between these. Nor is it likely to be
cost-efficient, for purposes of regular reporting, to monitor the split of materials
consumption between cate-gories of purchasers of finished goods.
Another matter is the possibility of splitting materials consumption between sub-sectors
of secondary industry. Since the same materials may be handled in turn by
several branches, there are only two ways of doing this "cleanly": (1) to
ascribe consumption of materials to the first branch that handles them, or
(2) to ascribe it to the last branch that handles them. The former approach leads
to such unsurprising results as that the iron and steel industry is responsible for
practically 100% of iron ore consumption, the mineral products industry for most clay and
limestone consumption, and so on. The latter approach can yield much more interesting
results. How much of steel consumption ends up in deliveries from the construction
industry? The vehicle industry? The electrical goods industry? - What is the eventual
split of timber consumption between the printing, paper goods, furniture, construction and
other industries? This kind of information at once tells us which kinds of products
it is most important to target (in policies towards purchasers and which production
chains it is most important to target (in policies towards industry).
Information of the latter kind can - with some qualifications - be obtained from
economic input-output analyses (see for instance Behrensmeier and Bringezu 1995a, who have
used this method to estimate total "material input" behind final deliveries from
23 sub-sectors of industry in Germany).
The input-output method does have its limitations. It may nevertheless be possible to
refine and adapt I-O analysis so that acceptable estimates can be made at regular
intervals of how consumption of major materials is split between secondary sub-sectors
delivering finished products. For reporting at the level we are presently discussing, it
will naturally only be possible to cover a selection of the most important materials, and
a limited number of sub-sectors in each case. For most materials, the sub-sectoral split
of most fundamental interest will be that between construction and manufac-turing. Within
manufacturing, it should be of interest to split consumption between deliveries of
investment goods, consumer durables and consumer non-durables, since these may be the
targets of different policy measures.
3.6.3 Consumption patterns and technologies
The forces driving (or braking) resource consumption may at the most aggregated level -
that of a total economy - be regarded as:
- the level of final consumption of goods and services (in this context including
investment goods)
- the mix, or "pattern" of consumption (as between more and less
resource-intensive goods and services)
- technology, or more precisely the (in)efficiency with which resources are used to
produce each type of good or service.
The first of these is conventionally measured in money values, and equates in a closed
economy to the GDP. The use of the GDP as an indicator of production or (roughly) of
consumption levels has been widely criticised, most particularly on the grounds that it
excludes "informal" production. How-ever, most such informal production consists
of services which (in Western Europe) add little to the resource load of a society. For an
analysis of our kind, therefore, the GDP would seem an acceptable measure of the first
driving force1.
The mix of consumption (and, at a less detailed level, of investments) is also
regularly measured in national accounts, but the various product categories are not
conventionally ranked in terms of resource intensity. So there is no conventional
measure of the sustainability of consumption patterns.
The combined effect of factors 2) and 3) is sometimes expressed by the
"intensity" of the economy with respect to particular resources, most commonly
energy (e.g. MJ per unit of GDP). However, such indicators are inadequate, as they mask
the relative contributions of technological improve-ments, of changes in consumption
patterns and in industrial structure to increasing or decreasing resource inten-sity.
(Changes in industrial structure can be an important independent variable in an open
economy, where the structure of production is not determined only by domestic consumption,
but also by what a country happens to import and export).
Therefore, we need to look for more specific indicators, which can tell us on the one
hand something about the sustainability of consumption and invest-ment patterns, and, on
the other, the resource intensity of production - and do so in ways that are comparable
over time and across countries.
Economic indicators of consumption patterns
The possibility of constructing a single indicator of the sustainability of consumption
patterns (as defined by economists) hinges on that of ranking categories of consumption
in terms of resource cost in relation to price. If people spend a given income on
products that cost a lot of resources per ECU, then the pattern of consumption is less
sustainable than if they spend it on products that cost a lot of ECU per resources.
As already mentioned, the number of ECU spent on various categories of goods and
services in EU countries is already available from national accounts. The first problem is
therefore one of estimating the claims made on environmental space by corresponding
categories of consumption.
First-order estimates of the amounts of materials expended to
facilitate broad categories of private and government consumption have been made in
Germany, using economic input-output matrices (Behrensmeier and Bringezu 1995b, see Table
3). Estimates of the amounts of energy expended for the sake of similar consumption
categories have for instance been made in Norway, using existing estimates for some
product categories and production steps, and ad-hoc estimation procedures to fill in the
gaps (Hille 1995, see Table 4).
Table 3. "Material input" occasioned by consumption categories in W. Germany,
1990.
(Min. = Minerals, FF = Fossil fuels, Bio. = Biotic raw materials, Tail. = Tailings and
overburden (from mining), Exc. = Excavation for construction, Ero. = Erosion.)
| Material input (tons per capita per year) |
| Consumption
category |
Min. |
FF |
Bio. |
Tail. |
Exc. |
Ero. |
Total |
% |
| Food, beverages, tobacco |
1.25 |
0.40 |
2.29 |
2.48 |
0.16 |
1.47 |
8.05 |
15 |
| Clothing and footwear |
0.36 |
0.11 |
0.09 |
0.70 |
0.06 |
1.11 |
2.43 |
5 |
| Dwellings and residential energy |
3.70 |
1.29 |
0.25 |
7.66 |
1.00 |
0.11 |
14.01 |
26 |
| Furniture and household operation |
0.95 |
0.17 |
0.21 |
1.48 |
0.07 |
0.24 |
3.12 |
6 |
| Health and personal care |
0.51 |
0.10 |
0.07 |
0.78 |
0.06 |
0.04 |
1.56 |
3 |
| Transport and communications |
1.98 |
0.93 |
0.10 |
2.88 |
0.15 |
0.07 |
6.12 |
12 |
| Recreation etc. |
1.26 |
0.16 |
0.31 |
2.22 |
0.10 |
0.15 |
4.20 |
8 |
| Other goods and services |
1.26 |
0.14 |
0.12 |
1.76 |
0.10 |
0.06 |
3.44 |
6 |
| Govenment consumption |
3.52 |
0.54 |
0.33 |
4.88 |
0.62 |
0.20 |
10.09 |
19 |
| Total |
14.79 |
3.84 |
3.76 |
24.85 |
2.31 |
3.47 |
53.02 |
100 |
Source: Behrensmeier and Bringezu 1995, figure 4 (basic figures provided by H.
Schhtz, Wuppertal Institute).
However, the problems involved in distributing consumption of environ-mental space
among consumption categories (and investment categories, if these are treated separately)
should not be underestimated. Studies such as those mentioned show a great need for more
basic data as well as improved methodologies. If these problems are overcome, the question
will remain of how consumption of energy, of materials (however aggregated) and of land
(in one or more senses) should be weighted. This problem is essentially no different from
that which arises in making comparative life-cycle analyses of individual products.
Another problem is that the relative prices of product categories vary over time and
across countries, so that a "sustainability ranking" of product categories would
not necessarily be valid everywhere or forever.
Table 4. Energy consumption occasioned by consumption categories in Norway, 1992.
Consumption category
|
Percentage of real energy demand (est. 1992) |
Percentage of money value of consumption (Nat. accounts 1991) |
| Food, beverages, tobacco |
16.5 |
17.9 |
| Clothing and footwear |
2.5 |
4.8 |
| Dwellings and residential energy |
30.5 |
13.5 |
| Furniture and household operation |
3.0 |
4.7 |
| Health care etc. |
1.0 |
3.6 |
| Transport and communications |
24.0 |
9.2 |
| Recreation etc. |
4.0 |
6.4 |
| Other goods and services |
2.5 |
8.1 |
| Government consumption |
11.0 |
29.7 |
| Unallocated, including energy
for energy infrastructure |
5.0 |
- |
Source: Hille 1995.
One way of simplifying things could be to limit the number of consumption categories to
three: those with unambiguously high resource/ECU ratios, those with
unambiguously low resource/ ECU ratios, and the remainder. This would necessitate
splitting some of the broad categories shown in Tables 3 and 4, before regrouping them.
There is something to suggest that, for instance, animal foods, private-car transport and
residential energy would be found to belong to the "high" category in most if
not all EU countries, whereas much of government consumption and private consumption of
non-transport services would belong to the "low" category.
If further study should confirm the possibility of identifying such "high"
and "low" categories, then a "sustainability of consumption index"
might be constructed, for instance by subtracting volume changes in consumption of very
high resource/ECU products from those in consumption of very low resource/ECU products.
The validity of such an index would of course need to be kept under review. Should
ecotaxes reach levels at which one ECU spent on car transport no longer led to
unambiguously greater resource consumption than one ECU spent on a haircut, the index
would have served its purpose and could be discontinued.
Physical indicators of consumption patterns
Whether or not is found possible to develop a single measure of the sustain-ability of
consumption patterns, it will certainly be useful to report regularly on absolute
consumption of the goods and services that place the highest absolute claims on
environmental space.
These are quite easy to identify. They are (1) food, in particular animal foods; (2)
transport and (3) buildings, including the energy used to heat, cool, light and ventilate
them.
Together, these things are responsible for most of our claims on environmental space
for agricultural land, built-up land, materials and energy.
When "consumption" of these products is considered in physical units, there
is no compelling reason to distinguish between consumption in the strict economic sense
and investments, or even inputs to production (such as goods transport, business trips or
food bought by restaurants). (The relevant physical units are: animal foods in MJ,
buildings in square metres, transport in passenger- and ton-kilometres).
There is one qualification to the previous point, if we are concerned with real
consumption. In an open economy, some investments and inputs - some buildings, some goods
transport and some business trips - will be serving export production rather than local
consumption. In the case of buildings, this will apply especially to manufacturing
premises, much less to buildings for the service sector, and not at all to dwellings. One
might choose to include only the latter two categories in an indicator; in any case, their
share of the total should be specified. It is hardly practically possible - for purposes
of regular reporting - to differentiate between transport serving export production and
the remainder, although the relative order of magnitude of such transport will need to be
(implicitly) estimated at intervals, as part of the basis for estimating real domestic
consumption of energy and materials (cf. section 3.5). For annual reporting purposes, the
raw figures must do.
While food, transport and buildings are of the greatest importance, it may also, in
in-depth reporting, be found useful to include physical-unit data on develop-ments in some
other consumption categories. One instance is clothing and other textile goods (of
interest due to the very high land and water intensity of cotton production, high land
intensity of wool production and high toxic-emissions intensity of synthetic as well as
natural fibres).
Technology
Above, we described technological efficiency as one of three logically distinct factors
influencing resource consumption, the others being the level and the mix of final
consumption.
For reasons that we have already touched on, however, it would not only be difficult
but also of doubtful relevance to link reporting on technological efficiency directly to
final con-sumption categories in the stringent economic sense. Estimates of resource
inputs by consumption category are likely to remain so approximate that monitoring
changes, at least at intervals of up to a few years, will be difficult. More importantly,
many of the goods consumed in a given country (or the EU) are imported, so that
policy-makers cannot influence the efficiency with which they are produced, whereas they can
influence that of their own export industries.
Energy efficiency
Hitherto, reporting on technological efficiency has concentrated mainly on energy. To
the extent that such reporting has been desegregated it has generally been by
"sectors" similar to those listed in section 3.6. There are quite good technical
reasons for this, since the possible technical meanings of energy efficiency - or the
inverse, energy intensity - vary as between the sectors. Also, some of these sectors can
simultaneous-ly be linked to the physical consumption indicators suggested above (food,
transport, dwellings and buildings for the service sector).
In the residential and service sectors, it is most relevant to express
intensity as energy consumption per square metre (and heating or cooling degree-day, in
making comparisons over time or across countries).
In the transport sector, energy intensity should be expressed as energy
consumption per passenger- and ton-kilometre.
In the secondary industry sector, it is hardly possible to arrive at simple,
physical indicators of energy intensity. Most energy consumption in the sector is for
actual production processes, delivering an enormous range of incommensurable products. The
only simple, practicable measure of intensity is that of the economist: energy consumption
per ECU of output.
In agriculture and fisheries, intensity can also be expressed as energy
consumption per ECU. Alternatively, it can be expressed as energy consumption per unit of
food energy output. A shift towards more vegetable relative to animal food production
would be likely of itself to lead to a drop in the latter measure. To avoid
"double-counting" such an effect, the energy-per-ECU measure might be preferred.
In the energy sector, the measure of intensity is rather obvious, namely primary
energy input per unit of final energy delivered to users.
Along with sectoral indicators, an aggregate measure of energy intensity is
still to be desired. This could be constructed as an index, by weighting percentage
changes in intensity in each of the sectors above, according to their share in total
primary energy consumption.
Materials
Indicators of materials efficiency present greater challenges than those of
energy efficiency, and not only because of the variety of materials to be considered.
If we conceive materials intensity as consumption of primary (extracted-from-Nature)
materials per unit of service or satisfaction provided by goods - a way of thinking that
we have touched on previously - then there are at least six ways of reducing intensity:
- lessen wastage of materials during production
- "shrink" products (use less materials relative to the goods' utility value)
- substitute recycled for primary materials
- increase product lifetime
- substitute goods or services with inherently low materials intensities for goods with
high intensities (e.g. televised texts for newspapers)
- increase the intensity with which each product is used during its lifetime.
(In the great majority of cases, each of these measures also leads to less
energy consumption).
The last method is unambiguously a way of increasing the efficiency of consumption,
rather than of production. The fifth would conventionally be regarded as a change in the mix
of consumption. We shall not consider these two further in this context.
Whether increasing product lifetimes increases the efficiency of production (in
economic terms) depends on how increasing durability affects product prices. Irrespective
of this technical point, however, it would certainly be useful to track developments in
absolute product lifetimes. Retrospective information on lifetimes - i.e. the average age
at which products are abandoned - is directly available only for a few products, such as
motor vehicles, which must be registered and deregistered. For other products, sampling or
statistical estimation procedures are required. The usefulness of reporting based on such
techniques nevertheless deserves further consideration. So do the possibilities of
prospectively monitoring product durability and reparability, through testing and
assessment procedures of new products.
The remaining methods of increasing materials efficiency: reducing wastage, product
shrinking and increasing recycling, are listed in increasing order of importance as well
as ease of measurement. Absolute wastage is a quantitatively minor problem
for most materials. For instance, it is true that only 55-60% of the timber entering a
sawmill comes out as sawn timber, but most of the remainder is generally either used as
raw material in the pulp, paper or board industries, or converted to energy. Similarly,
the metals "wasted" in stamping, cutting etc. in the engineering industry are
increasingly recycled. Also, monitoring wastage for a range of important materials through
all stages of the many production chains they enter into, is likely to prove costly.
Product shrinking may have considerable untapped potential for some product
categories, while in others it is constrained for instance by the dimensions and/or
capacities of the human body (consider clothing, furniture, passenger vehicle bodies or
reading matter).
It will be somewhat easier to monitor the (sales-averaged) weight of specific consumer
goods on the market than to monitor wastage in production. A number of problems would,
however, remain on the way to constructing meaningful indicators. For some kinds of goods,
utility value per unit may change markedly over time. Also, weight reductions may be due
to material substitutions, which can be good or bad depending on the availability and
life-cycle characteristics of the materials in question. And indicators would have to be
in the shape of composite indices for product categories, since the alternative -
selecting a small number of specific "indicator" products - could yield very
misleading results.
It may be possible to monitor consump-tion of specific materials, and/or of materials
in aggregate, per square metre of new building construction, which is important on account
of its large share in total materials consumption. In the case of other construction
(infrastruc-ture), finding common denominators will be more difficult.
Recycling has enormous unrealised potential in the case of metals and very large
potential in the case of timber (both paper and construction timber), though somewhat less
in the case of most industrial minerals.
Recycling rates (or rather rates of recovery-for-recycling compared to total materials
consumption) are also much easier to calculate for a whole economy, than are rates of
wastage or product shrinking. Recycling rates for aluminium, paper and glass are already
included in some environmental indicator sets. The list should be expanded. For instance,
iron/steel and copper are both, on account of volume or specific environmental load
combined with scarcity, of greater concern than aluminium. Construction timber is in most
countries at least as important in volume as paper. Other demolition "waste",
which can replace fresh aggregates in new construction, is also important. It may also be
useful to monitor recycling of plastics, although technical problems remain to be solved
before this can be considered of unambiguous environmental benefit.
While it may be difficult to find good indicators for some of the specific measures
that can be taken to improve materials efficiency in production, it may be possible to
develop indicators which subsume all such measures. The very simplest method of
doing this would be to divide input of (a selection of) raw materials to the secondary
sector, by total output of that sector (in ECU). Materials "put in" in the shape
of imported semis or parts, already pro-cessed to beyond the chosen standard level of
measurement, would then have to be "converted" (this would for instance mean
converting imported pulp or sawn timber to roundwood equi-valent). So far as possible,
conversion factors should then reflect current efficiencies and recycling rates in the
domestic economy.
The most important problem in measuring intensity in this way (e.g. timber, pig iron or
cement consumption per ECU of secondary output) is once again variations in industrial
structure, over time and between countries. For any one raw material, structural changes
in the secondary sector of an economy are liable to have even greater consequences than
they will have for energy consumption. (All secondary branches consume energy; only one or
a few handle large amounts of timber, chlorine, copper or cement). Applying structural
correction factors is again one possible solution.
Alternative approaches would be
- - to select only one or two indicator branches for each indicator material - measuring,
for instance, pig iron/steel consumption per unit of output in the engineering industry,
cement con-sumption per unit of output in the construction industry, chlorine con-sumption
per unit of output in the chemical industry, and timber consumption per unit of output in
the pulp and paper and construction industries. By weighting percentage changes, such
measures could also be aggregated into a materials efficiency index. This would mean a
gain in comparability over time, but greater expense and probably a certain loss of
relevance. This is because improve-ments in efficiency would be mea-sured only over parts
of production chains.
- to base an indicator on aggregate consumption of all kinds of materials in tons, whether
measured at the raw material/semi level or in terms of "material input". The
advantages and disadvantages of these solutions follow from the discussion in section 3.5.
3.7 Background indicators (2) : Factors affecting driving or braking
forces
In the two preceding sections, we have discussed three forces that may drive or brake
resource consumption: the levels of consumption and investments, the mix of these, and the
resource intensity of technologies. Each of these is in turn determined by a range of
factors, on some of which it may be useful and feasible to develop indicators.
GDP growth
The factors affecting the level of final consumption (plus investment) are
extremely complex, and cannot be entirely separated from those affecting the mix of
consumption.
Most conventional explanations of growth in the GDP focus on the supply (production)
side of the economy. In other words, the desirability of the highest possible level
of consumption is taken for granted (with the one modification that people also want some
leisure time, which is a constraint on production and therefore on consumption). So all
that needs to be explained is how human, organisational, technological and other factors
make it possible to fulfil the goal of economic growth.
By contrast, environmental and other NGOs have often focused on the artificial
creation of demand. The means at which they have pointed range from advertising and
planned obsolescence to urban planning that inflates transport needs and wage differences
that make role models of people with extremely high levels of consumption. Indicators of
these (advertising expenditure; urban density; wage differentials) and other factors might
indeed be constructed, and in some cases already exist.
Mix of consumption
Factors affecting the mix of consump-tion include many of the objective realities that
can also be said to inflate its aggregate level, besides a host of cultural, social and
psychological factors that are hard to quantify. However, one very important factor is
eminently quan-tifiable, namely the price relationships between different goods and
services.
These are of most immediate interest where we can identify directly competing products
with clearly different resource loads. How is the price of meat evolving relative to those
of vegetable foods? The price of owning and operating cars relative to those of public
transport?
The case for claiming that these products have different resource loads can be stated
independently of their prices. (Most) vegetable foods claim less resources per unit of
nutritional energy than (most) animal foods. Similarly, public transport as a rule
claims less resources per passenger-kilometre than private-car transport.
However, all kinds of products ultimately compete with one another. If the price of
petrol is doubled and those of cinema tickets halved, people are likely to drive less and
go more often to the cinema. The resource loads of car driving and cinema attendance
cannot be compared against any physical yardstick, only in per-ECU terms. If we can
identify broader categories of goods and services which currently have distinctly
different resource loads per ECU (cf. the discussion in section 3.6.3), then it should be
of interest to monitor their relative price trends for as long as these differences exist
(in fact, this would be a precondition for keeping a check on the validity of any
"sustainability of consumption index").
Technology
The efficiency with which natural resources are utilised in production is likewise
influenced by their prices, both absolute and relative to other inputs, especially labour.
Other factors affecting technological efficiency include the funding and effectiveness
of R&D; in relevant fields, the efficiency with which relevant information is
disseminated and the attitudes of management and workers and the organisation of labour.
Attempts have been made to quantify some of these also. In Norway, it has even been
proposed to construct a single indicator of the country's contribution to technical
innovation leading to resource savings. The feasibility of the latter, however, remains
dubious. Government financial support for resource-saving measures may be easier to
measure, cf. next section.
3.8 Background indicators (3): Policy responses
Policies to promote compliance with environmental space will necessarily be
many-faceted, including both legal and financial instruments, shifts in government
investment policies, education, information and so on. Many of them will be difficult to
quantify. It is in accordance with the principle of subsidiarity that countries should
find their own ways of reaching the target, and that the methods chosen may be
incommensurable.
Despite these caveats, it may be of interest to develop indicators for some of the
responses which are easiest to quantify, that is: taxes and direct government outlays on
measures designed to reduce resource consump-tion. We shall suggest three fields for such
indicators.
The first is consumer-level taxes (less subsidies) on more vs. less sustainable
categories of goods and services. In this context, "more sustainable" means
"costing less resources per ECU, if neither taxed nor subsidised". Ideally, one
might desire an indicator of average tax rates on broad categories of goods and
services ranked according to sustainability, as discussed in connec-tion with the mix of
consumption. However, calculating average net tax rates for the whole range of goods and
services might prove a difficult operation, and still produce results "blurred"
for instance by taxes introduced for health or social reasons.
A simpler approach would therefore be to compare net tax or subsidy rates on a small
number of goods and services, or kinds of goods or services, of particular interest. They
could for instance be: domestic air travel, new cars, petrol, domestic electricity, public
transport and a selection of low-resource, non-transport services.
It would also be useful to monitor the relationship between taxes on labour and on
natural-resource inputs to production. At the moment, there are few taxes on material
inputs to production (fertilisers are an exception in some EU countries). To begin with,
therefore, the matter would boil down to comparing energy and labour taxes.
It is important to note that direct and visible tax and subsidy rates cannot be relied
on to tell the whole story of how governments influence costs or prices. For
instance, the case has been made in many countries that car transport and/or electricity
generation are at the receiving end of substantial "hidden" and/or indirect
subsidies. It is hardly realistic, however, to expect agreement on the extent of such
subsidies or how indicators should be constructed to expose them.
We have also suggested an indicator of government outlays to promote resource
conservation. This obviously raises problems of delimitation; in particular, it can be
difficult to determine whether R&D; expenditures have resource savings as their main
objective or not. It may be easier to delimit direct financial support for the implementation
of conservation measures, plus information and counselling activities.
3.9 Background indicators (4): Effects of resource (over)- consumption
As Fig. 2 suggests, some of the effects of resource consumption - especially
polluting emissions - are better covered by present environmental indicator systems than
is resource consumption itself. There is, however, an important hitch even to these
"some". This is that the environmental pressures created by exploiting resources
which Europe im-ports, in more or less processed forms, from other continents, do not show
up in European statistics. Nor is it probably feasible to estimate more than at best a
very few of these effects. This in itself is one very good reason for reporting on what
can at least be estimated, viz. the consumption of (European and imported) resources as
such.
The other major effects of European over-consumption of resources, i.e. that
non-renewables are being depleted and that Europeans are also occupying more than their
share of the space for renewables, are not generally reflected in environmental reporting.
Some national reporting systems do give information on the ratio of national reserves to
production (R/P ratio) of selected mineral resources. However, this is not the central
question according to the environmental space concept. Rather, it is the ratio of national
consumption to global resources (as distinct from reserves).
There may be good reason, in national and EU-level reporting, to present indicators comparing
present per capita resource consumption to the global average, as an indicator of
present disparities and progress (if any) in reducing them.
Apart from this, we have already emphasised that reporting on resource consumption must
be linked to targets. The adoption of targets presupposes an assessment of the full
range of effects of resource consumption, on the environment as well as on inter- and
intergenerational equity. More important than further groups of indicators, therefore,
will be the inclusion in in-depth reporting of an introduction explaining how targets have
been established.
3.10 Conclusion
In order to guide policy-making directed at compliance with environmental space, there
is a compelling need for the EU and Member States to improve reporting on resource
consumption. This applies with particular force to materials consumption, but also to
energy, water and land use.
Improved reporting on resource consumption as such must be backed by and directly
linked to improved reporting on the forces driving it, as well as those which offer
possibilities of braking it, and which policies should be designed to strengthen.
In this chapter, we have discussed a set of indicators which might be included in a
system of reporting on progress towards compliance with environmental space. Some of
these, especially including a majority of the suggested "performance"
indicators, will be necessary elements of any such reporting system. Others have
been presented as options or alternatives to one another.
Further study will be required to determine the relative cost-efficiency of these
indicators.
Many of the proposed indicators will depend on new or improved estimation procedures.
Many are also dependent on basic data that are not currently collected in all EU countries
- in a few cases, not even in any. This is to be expected when indicators are required to
guide policy-making in new fields. The costs and benefits of expanded data collection
should be evaluated in this light, but also take account of the fact that many of the data
in question can be relevant as well to established planning objectives.
The EEA has a vital role to play in fostering and co-ordinating efforts towards
improved reporting on consumption of environmental space. This does imply a revision of
the Agency's present Work Programme, in which the focus, of monitoring efforts in
particular, is strongly on emissions and other environmental outputs. But it falls clearly
within the stated Mission of the EEA to focus also on resource use and on the driving
forces - the "human activities and economic sectors" - at the root of
environmental problems. A working goal for the EEA could be to present a first overview
report on the subject of environmental space in connection with the next major assessment
of Europe's environment, within the year 2000. By the same date, the EU as well as
individual member states should have adopted targets for reductions in resource
consumption.

1: There are obviously more reasons
why the GDP is inadequate as a measure of welfare or want satisfaction (as opposed
to consumption). For instance, it includes social repair costs, and takes no account of
the fact that goods may be used in ways that provide more or less satisfaction, more or
fewer "service units" (cf. section 1.3). But although it may be desirable for
some purposes to discuss resource intensity in terms of resource consumption per welfare
or service unit, the latter concepts are difficult to quantify. Also, goods that are
inefficiently used from the point of view of welfare provision demand no less resources
than if they are efficiently used. As a measure of the first force driving resource
consumption, GDP is therefore at least as valid as these alternative concepts.

Document Actions
Share with others