5. Data sources
The list of sources of data from each country utilised in this
report is given in Table 5.1. The various data sources are
summarily described in the following.
5.1. APIS and EoI data bases
The basic source of data for the present report was to be the data
files transmitted to the DG XI under the EoI Decision, and the APIS data base into which
the EoI data files are fed for statistics calculations and presentations.
Following the decision that the first annual AQ report was to
present 1993-94 data, the EoI files and APIS had to be updated. This updating process was
carried out by deviance Consulting, SA, Brussels, under a separate contract with the Topic
Centre on Air Quality. The updating process was finalised in the end of October 1995.
Updated EoI files and APIS was made available to the Topic Centre, complete as far as data
were available from the states, by that same date.
Table 5.1 shows which countries provided
EoI/APIS data for the 1993-94 update. The data from the new EU countries have not yet been
entered into APIS.
For the reported stations, the EoI data base contains the necessary
air pollution data asked for by the EU Council Directives. For some cities and stations it
was rather difficult to find the city and station names.
For the reported stations, the APIS data base seems complete
concerning the air pollution data asked for by the EU Council Directives. Information on
geographical co-ordinates and description of the local environment are not complete for
all stations. For many stations there is no information available as to the traffic
conditions in the environments.
Trend figures for SPM do not show the 95 percentile of daily values
which is asked for in the EU Council Directive, but instead the 98 percentile is shown.
The 1993-94 data in the APIS/EoI data base was rather limited. Only
9 EU Member States have reported data. APIS does not contain data from non EU Member
States.
5.2. Other sources of country-specific data
After the updating process of APIS, it was apparent that the extent
of data for 1993-94 contained in APIS and in EoI files was rather limited, and much too
limited to provide a basis for evaluation of European air quality for that year. Data was
missing completely from many countries. Also, APIS and EoI base contains data only for EU
Member States.
In order to be able to present a somewhat more complete picture of
local air quality in Europe in the first pilot report, it was then decided to resort to
other sources of data on the national level. National air quality reports were collected
to the extent they were easily available, or could easily be acquired through contact
persons. No request was sent out to all countries.
National reports were thus available from the following countries:
Czech Republic, Denmark, Germany, the Netherlands, Norway, Liechtenstein, Slovakia,
Sweden, Switzerland, United Kingdom (only for the automatic network). References are
listed in Appendix A. Data listings were available from France, Italy and Portugal.
The national reports are naturally quite different regarding layout,
data statistics parameters calculated, and presentations of the data. As a general rule,
the national reports do not give all of the statistics parameters that are requested in
the EU Directives or EoI Decisions. Thus, the national reports do extend the picture of
European air quality, but summaries of similar data from each country tend to be rather
restricted, because the actual data values are not available.
5.3. Other sources of data
The EMEP report for 1993 was used to give a summary on regional air
quality in Europe.
The ozone report prepared by ETC-AQ (de Leeuw et al., 1995) was used
to give a summary of urban and regional tropospheric ozone in Europe, although this report
contains data only from 1994.
5.4. Total extent of data used in this report
Table 5.1 gives an overview the main sources of information on local
air pollution from each country. It is seen that EoI data has been available from 5
countries, APIS data from 6 countries (also in EoI), and data from national reports from
13 countries. Totally, data from 21 countries were available on local air pollution. Table
5.1 also gives the number of cities and stations for each of the countries.
All the data available from these cities and sites are given in the
country-wise tables in Appendix B.
A selection was made for the purpose of presenting a preliminary
overview of local air quality in Europe in the present pilot report. For each country, 1-5
cities with fairly high air pollution levels were selected. In each city, the most
polluted site with a fairly complete list of compounds monitored, was chosen. Later, the
selection can be made more complete. The selected cities are shown on the European map in
Figure 5.1. The names of the selected cities in each country is given in Table 5.2.
The EMEP data base contains regional pollution data from 26
countries, for a total of 92 stations. The ozone data base (1994 data) collected by the
ETC-AQ contains data from 13 EU Member States, and a total of 378 stations (annual
statistics data).
Table 5.1: Overview of extent of data from
the various data sources on local air pollution.
| Country |
APIS |
EoI |
National
Reports |
| Number |
Number |
Number |
| Cities |
Stations |
Cities |
Stations |
Cities |
Stations |
| Albania |
|
|
|
|
|
|
| Austria |
|
|
|
|
7 |
41 |
| Belarus |
|
|
|
|
|
|
| Belgium |
7 |
18 |
4 |
17 |
- |
- |
| Bulgaria |
|
|
|
|
|
|
| Croatia |
|
|
|
|
|
|
| Cyprus |
|
|
|
|
|
|
| Czech Republic |
- |
- |
- |
- |
2 |
16 |
| Denmark |
2 |
2 |
- |
- |
2 |
3 |
| Estonia |
|
|
|
|
|
|
| Finland |
- |
- |
4 |
5 |
- |
- |
| France |
|
|
|
|
5 |
36 |
| Germany |
- |
- |
- |
- |
39 |
141 |
| Greece |
1 |
3 |
- |
- |
- |
- |
| Hungary |
|
|
|
|
|
|
| Iceland |
- |
- |
1 |
1 |
- |
- |
| Ireland |
- |
- |
3 |
6 |
- |
- |
| Italy |
|
|
|
|
211) |
186 |
| Latvia |
|
|
|
|
|
|
| Liechtenstein |
- |
- |
- |
- |
1 |
1 |
| Lithuania |
|
|
|
|
|
|
| Luxembourg |
- |
- |
1 |
1 |
- |
- |
| Malta |
|
|
|
|
|
|
| Moldova |
|
|
|
|
|
|
| the Netherlands |
13 |
26 |
- |
- |
- |
- |
| Norway |
- |
- |
- |
- |
7 |
7 |
| Poland |
|
|
|
|
|
|
| Portugal |
|
|
|
|
142) |
69 |
| Romania |
|
|
|
|
|
|
| Russia |
|
|
|
|
|
|
| Slovakia |
- |
- |
- |
- |
2 |
11 |
| Slovenia |
|
|
|
|
|
|
| Spain |
4 |
14 |
- |
- |
- |
- |
| Sweden |
- |
- |
- |
- |
10 |
13 |
| Switzerland |
- |
- |
- |
- |
5 |
18 |
| Turkey |
|
|
|
|
|
|
| Ukraine |
|
|
|
|
|
|
| United Kingdom |
13 |
15 |
- |
- |
9 |
10 |
1) Including province of Milano.
2) Including 7 industrial areas.
Figure 5.1: Selected cities in 20 countries for presenting a
preliminary overview of local air quality in Europe.
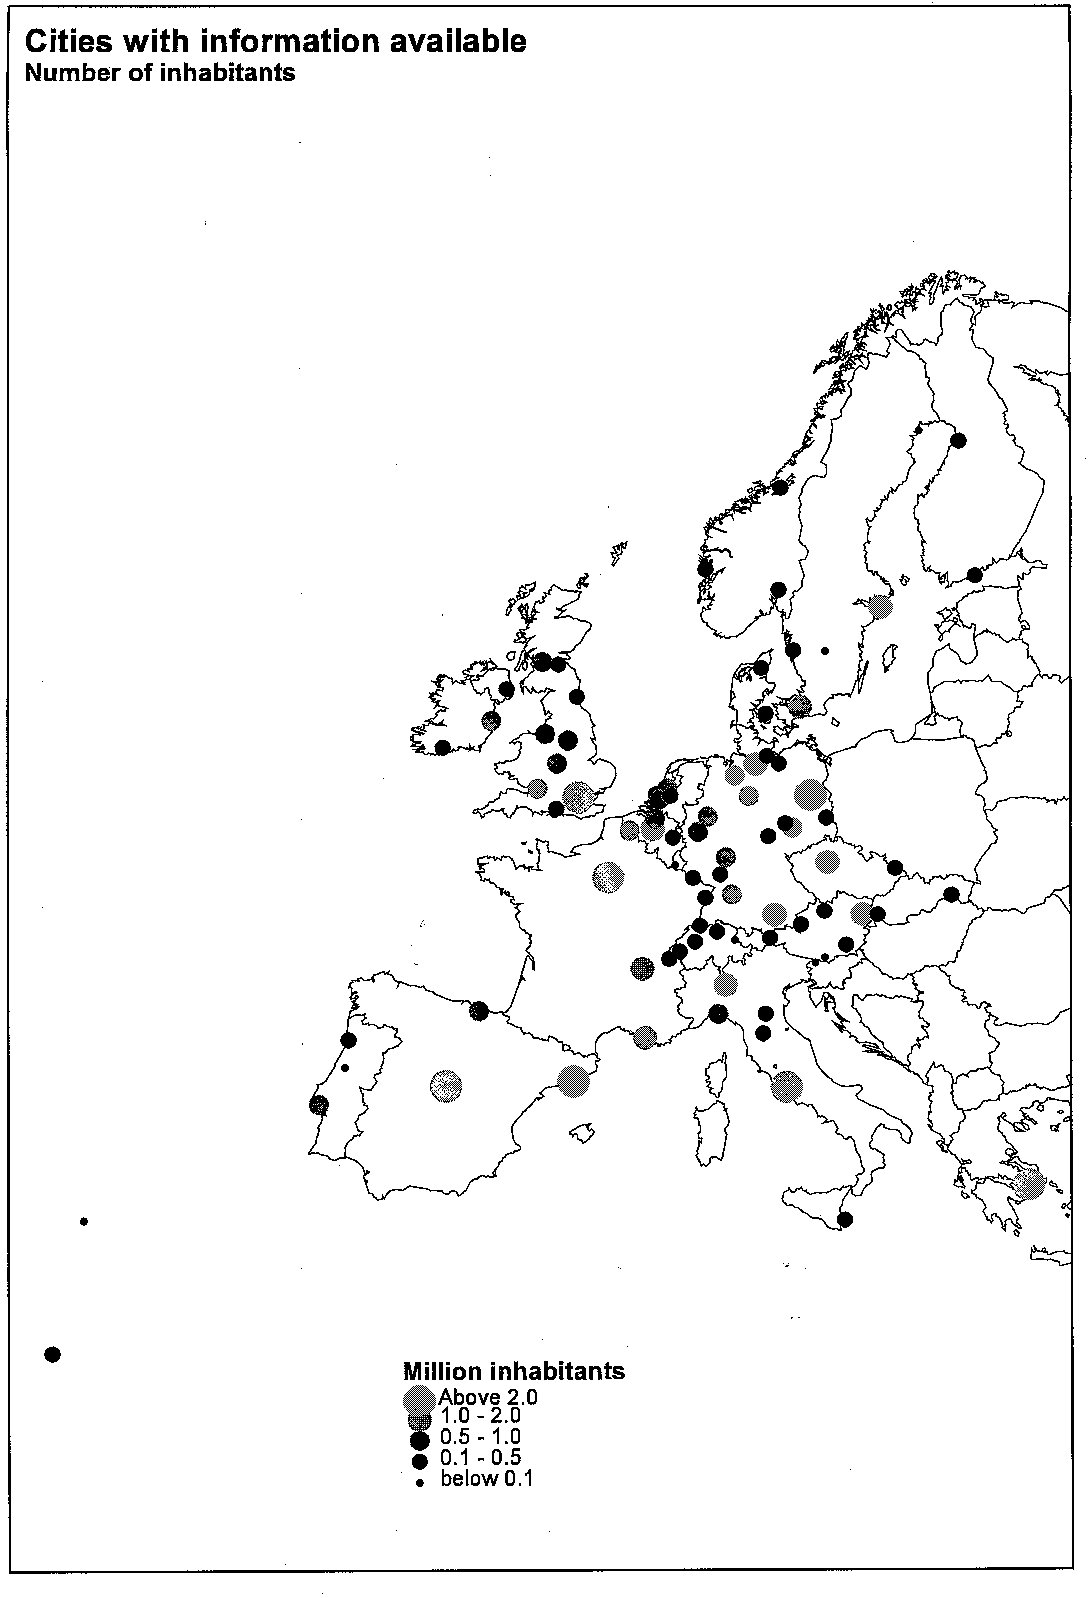
Table 5.2: Selected cities in 20 countries
for presenting a preliminary overview of local air quality in Europe.
| Country |
City |
|
Country |
City |
| Austria |
Graz |
|
Italy |
Bologna |
| |
Innsbruck |
|
|
Firenze |
| |
Klagenfurt |
|
|
Genova |
| |
Linz |
|
|
Milano |
| |
Salzburg |
|
|
Roma |
| |
Villach |
|
|
Siracusa-Augusta |
| |
Wien |
|
Liechtenstein |
Vaduz |
| Belgium |
Antwerp |
|
Luxembourg |
Steinfort |
| |
Bruxelles |
|
The Netherlands |
Amsterdam |
| |
Liege |
|
|
Den Haag |
| Czech Republic |
Ostrava |
|
|
Rotterdam |
| |
Prague |
|
|
Utrecht |
| Denmark |
Aalborg |
|
Norway |
Bergen |
| |
Copenhagen |
|
|
Oslo |
| |
Odense |
|
|
Trondheim |
| France |
Lille |
|
Portugal |
Coimbra |
| |
Lyon |
|
|
Funchal |
| |
Marseilles |
|
|
Lisboa |
| |
Paris |
|
|
Porto |
| |
Strasbourg |
|
Slovakia |
Bratislava |
| Finland |
Helsinki |
|
|
Koice |
| |
Oulu |
|
Spain |
Barcelona |
| Germany |
Berlin |
|
|
Bilbao |
| |
Bremen |
|
|
Madrid |
| |
Cottbus |
|
|
Tenerife |
| |
Dortmund |
|
Sweden |
Göteborg |
| |
Erfurt |
|
|
Jönköping |
| |
Frankfurt |
|
|
Luleå |
| |
Halle |
|
|
Stockholm |
| |
Hamburg |
|
Switzerland |
Basel |
| |
Hannover |
|
|
Bern |
| |
Köln |
|
|
Genève |
| |
Leipzig |
|
|
Lausanne |
| |
Lübeck |
|
|
Zürich |
| |
Ludwigshafen-Frankental |
|
United Kingdom |
Belfast |
| |
München |
|
|
Birmingham |
| |
Saarbrücken |
|
|
Bristol |
| |
Schwerin |
|
|
Edinburgh |
| |
Stuttgart |
|
|
Glasgow |
| Greece |
Athens |
|
|
Liverpool |
| Ireland |
Cork |
|
|
London |
| |
Dublin |
|
|
Newcastle |
| |
|
|
|
Sheffield |
| |
|
|
|
Southampton |

</head0

Document Actions
Share with others