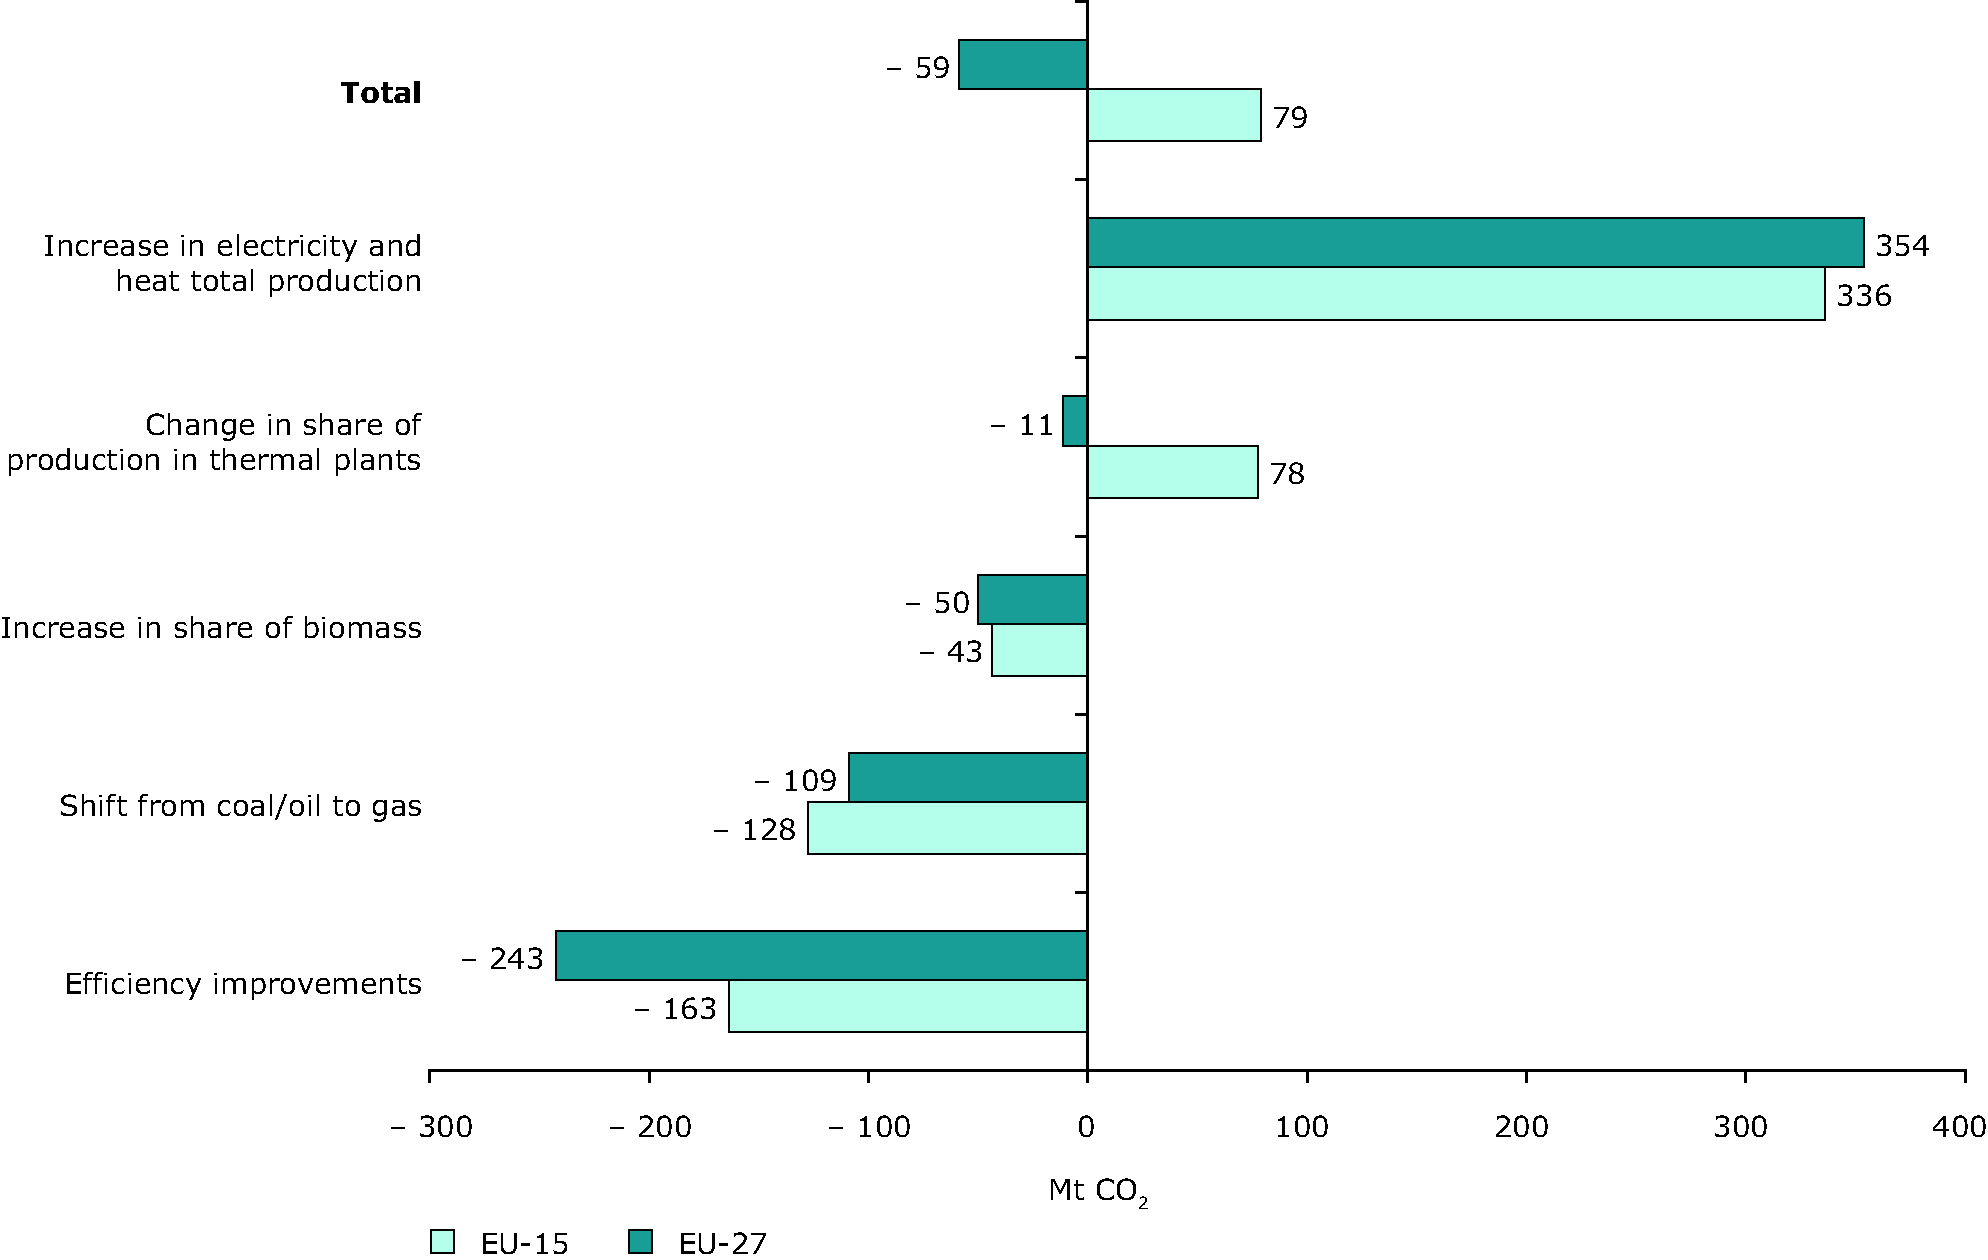
The bars with positive values indicate factors that cause an increase in emissions; the bars with negative values indicate factors that have a reducing effect.Aggregating all five effects provides the actual emission changes.'Change in share of production in thermal plants' describes the effect resulting from changes in the share of thermal plants in the total production of electricity and heat (including production by end users such as industries and households).'Efficiency improvements' describes the effect resulting from changes in the amount of fuel used in public power and heat plants per unit of electricity and heat produced.'Increase in share of biomass' describes the effect resulting from increases in the share of biomass in total fuel used in public power and heat plants.'Shift from coal/oil to gas' describes the effect resulting from the shift to less-carbon-intensive fossil fuels in public power plants.


Document Actions
Share with others