5. Transport
| indicator |
policy issue |
DPSIR |
assessment |
| transport eco-efficiency |
has the sector
been successful in becoming more environmentally efficient? |
pressure |
 |
| passenger transport demand |
has the modal splidt developed
towards more environmentally friendly modes? |
driving force |
 |
| freight transport demand |
has the modal split developed
towards more environmentally friendly modes? |
driving force |
 |
| price of transport fuels |
are fuel prices developing in a
direction stimulating less use of road transport? |
driving force |
 |
Rapidly growing transport volumes,
especially for road transport and aviation, have over the past
decades offset environmental gains from technology improvements.
Demand management policies are needed to de-link transport growth
from economic growth and to improve the balance between various
modes of transport. Current transport revenues only partly cover
the significant external costs of the sector, and current prices
tend to favour private road transport over public
transport.
Essential for economic activity and welfare,
transport is contributing more and more significantly to a number
of environmental and human-health problems — particularly climate
change, acidification, ground-level ozone formation, local air
pollution, noise, land take and habitat disruption. The Common
Transport Policy (European Commission, 1998) offers a framework to
bring together the supply of a secure transport system with
environmental and safety improvements. In a recent policy statement
on the Common Transport Policy for 2000-2004, the European
Commission stated that it: `will give particular attention to
measures designed to reduce the dependence of economic growth on
increases in transport activity and any such increases on energy
consumption, as well as the development of less environmentally
damaging energy alternatives for transport'.
5.1. Transport eco-efficiency
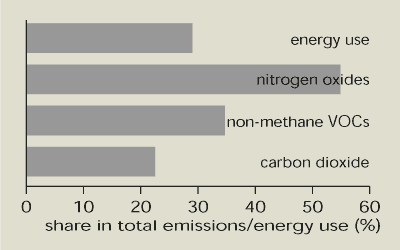
Transport is highly reliant on the use of
non-renewable fossil fuels and is therefore a major contributor to
greenhouse gas emissions (particularly carbon dioxide emissions;
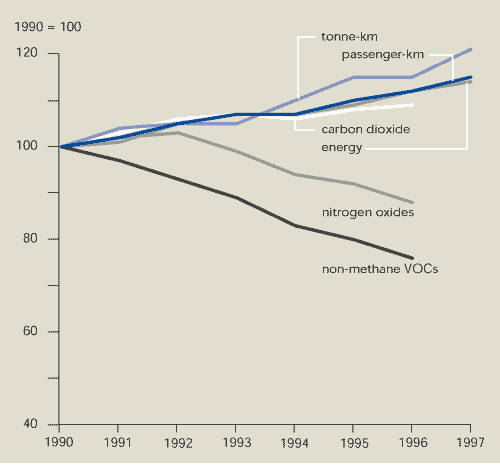
Figure 5.1). Energy and carbon dioxide efficiency (i.e. energy use
per passenger and per freight transport unit) has shown little or
no improvement since the early 1970s (Figure 5.2). The increasing
use of heavier and more powerful vehicles — together with
decreasing occupancy rates and load factors — has outweighed
increases in vehicle energy efficiency due to technological
advances. As a result, growing transport volumes led to about a 14
% increase in energy consumption and a 12 % increase in carbon
dioxide emissions between 1990 and 1996. These trends show that to
reduce the sector's energy consumption and emissions, policies
should now focus on demand-management measures to curb growing
transport volumes together with technical efficiency
improvements.
Figure 5.1. Transport
environmental profile in EU Member States, 1996
Source:
EEA-ETC/AE and Eurostat
By 2010, transport is expected to be the
largest single contributor to EU greenhouse gas emissions. This may
jeopardise the EU's achievement of its target of an 8 % reduction
in greenhouse gas emissions by 2008-2012 under the Kyoto Protocol
(see Chapter 8).
On the positive side, emissions of non-methane
volatile organic compounds and nitrogen oxides have been falling
since 1990 (Figure 5.2) — mainly due to the introduction of
catalytic converters in vehicle exhausts. However, the decrease has
been slower than expected as increasing transport demand has partly
offset engine improvements. Transport continues to be a major
contributor to acidification and air-quality problems (Figure 5.1).
In future, a significant further reduction of road emissions is
expected to be realised through the implementation of directives
resulting from the Auto-Oil programme (see Chapter 10).
Traffic noise is a key urban problem, but
harmonised country information is not available. However, it is
estimated that over 30 % of people in the EU are exposed to high
road-traffic noise levels, ± 10 % of people to high rail noise
levels, and possibly a similar proportion to aircraft noise.
Transport infrastructure takes land and may constitute a barrier
against the movement of species. It thus has a direct influence on
the occurrence and distribution of animal and plant species (see
Figure 14.3).
Figure 5.2. Transport
eco-efficiency (air emissions) in EU Member States
Source: EEA-ETC/AE and
Eurostat
 Limited improvements in transport eco-efficiency have
occurred in EU Member States.
5.2. Trends in transport
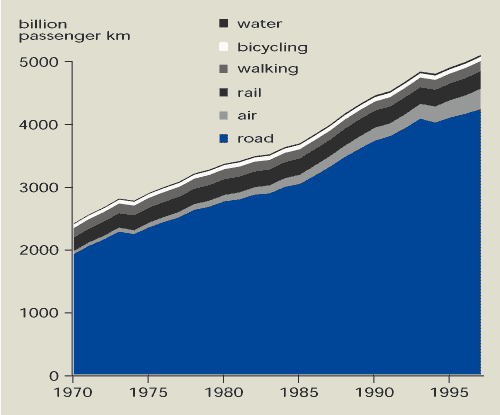
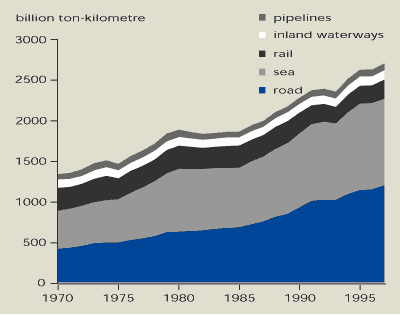
Passenger and freight transport have more than
doubled over the past 25 years, with the strongest growth being in
air and road transport (Figure 5.3, Figure 5.4 and Table 5.1).
During recent decades there has been a dramatic shift towards road
transport: the car increased its share of passenger transport from
65 % to 74 % between 1970 and 1997, and trucks now account for 45 %
of total freight transport compared with 30 % in 1970.
Between 1970 and 1997, passenger and freight
transport in the EU increased by an annual average of 2.8 % and 2.6
% respectively, while GDP growth over the same period was 2.5 %.
For road and air-passenger travel particularly, the boost in demand
can be attributed to higher incomes, a fall in transport prices in
real terms and changes in travel patterns (for example as a result
of urban sprawl). In turn, the demand and intensity of freight
transport is closely linked to changes in the volume and structure
of the economy and to infrastructure supply.
Infrastructure supply strategies (resulting in
an increase in motorway length by 195 % between 1970 and 1996,
while rail infrastructure lengths declined slightly) have over the
past decades enhanced the shift to road transport. Actions under
the EU Common Transport Policy to revitalise rail and to promote
inland waterways, combined transport and public transport have not
yet managed to break this trend. However, some positive signs can
be noted, such as better performance from short-sea shipping and
more high-speed rail lines. Better coordination of transport and
spatial planning (urban and regional), and the use of
telecommunications would also help to increase accessibility while
at the same time reducing the need for mobility. However, these
demand-management measures are poorly reflected in the Common
Transport Policy.
Figure 5.3. Passenger transport in EU
Member States
Source: Eurostat
Figure 5.4. Freight transport in EU
Member States
Source: Eurostat
 Passenger and freight transport volumes have more than doubled over
the past 25 years. Road transport is the most important mode of
transport.
5.3. Prices and taxes
Pricing is one of the key policy tools for
promoting an environment-friendly balance between different forms
of transport.
However, current prices tend to favour
private road transport over public transport. For example, rail and
bus fares have increased more rapidly than gross domestic product
(GDP) over the past decade, while the price of driving a private
car has largely remained stable (EEA, 2000). This distribution of
prices between private and public services is partly because
road-transport fuel prices (the perceived marginal cost of driving
a private car) have increased only slightly during the 1990s
(Figure 3.5 and Figure 5.5). A number of strategies to achieve fair
and efficient pricing were initiated in the Common Transport Policy
action plan 1995-2000.
Current transport revenues only partly cover
the sector's significant external costs. The external costs caused
by road and rail noise, local air pollution, climate change and
accidents are estimated at around 4 % of GDP; infrastructure wear
and tear and congestion add to this economic loss. Costs not borne
by consumers in 1991 are estimated to have been 70 % of the total
for road and 62 % for rail (EEA, 1999). It is expected that
internalisation of external costs will result in technological
improvements and increases in operational and organisational
efficiency. The overall effect on demand for mobility and modal
shares is likely to be smaller and will also depend on the
provision of efficient alternatives, e.g. to road transport. It is
estimated that transport volumes (both passenger and freight
transport) would be 10-15 % lower in the medium term under an
internalisation policy than if current trends continued (ECMT,
1998).
Fuel taxes provide the biggest contribution to
revenues from all environmental taxes (energy, pollution and
transport taxes (see Chapter 15). Fuel prices vary substantially
between Member States, with some countries showing an upward and
some a downward trend. Fuel taxes are mainly used to encourage a
shift towards more environment-friendly fuels. Fuel tax
differentiation has, for instance, been a major factor in the
phasing-out of leaded petrol in the EU. In 1998, leaded petrol was
4-17 % more expensive than unleaded petrol and up to 58 % more
expensive than diesel. As a result, the market share of unleaded
petrol reached 75 % in 1997 and leaded petrol is expected to be
completely phased out by 2005. Increased fuel taxes tend to
stimulate energy savings through technical-efficiency improvements
and thus reduce fuel demand.
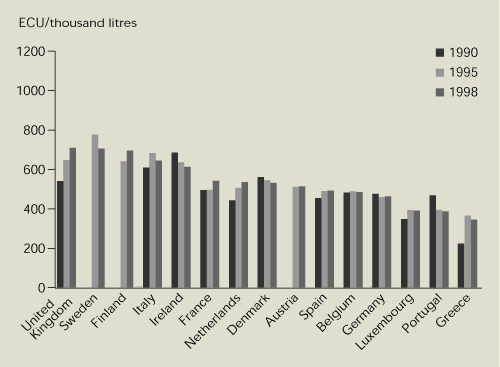
Figure 5.5. Prices of transport fuels
in EU Member States
Price of leaded petrol
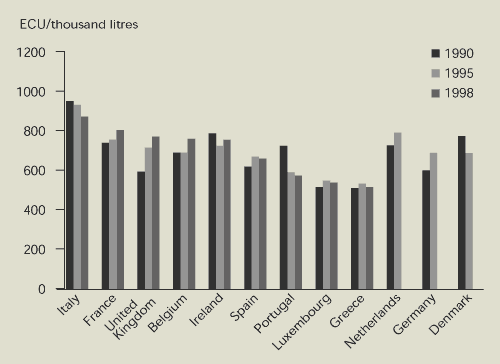
Price of unleaded petrol

Price of diesel automotive fuel
Source:
Eurostat
Note:
Based on the 1990 rate for the ECU. Leaded petrol is no longer sold
in Austria, Denmark, Finland, Germany, the Netherlands and
Sweden.
 Prices of transport fuels have increased only slightly
since 1990.
One way of making existing transport tax
structures more efficient is by shifting from national charges
(e.g. annual vehicle excise duties) towards more territorial
charges (e.g. road pricing through distance charges or tolls).
Introduction of marginal cost-based charges, such as electronic
kilometre charges for trucks, is deemed necessary to complement
fuel taxes (ECMT, 1999). Road pricing is already applied to
motorways in some countries and, in a few cases, in inner city
areas. However, the share of revenues from transport taxes (which
excludes taxes on motor fuels) in the total general tax burden did
not change between 1980 and 1997 (see Figure 15.2), demonstrating
the lack of a clear-cut shift to green tax reform in this area.
Price changes are only one factor influencing
transport demand: convenience and security also have a strong
influence on individual decisions over whether and how to
travel.
|
Cycle-friendly employers in
Nottingham
Car travel is increasing throughout Europe, but
over half of all car journeys are less than 6 km in length and 10 %
are for local trips covering distances of less than 1 000 metres.
Short car journeys are particularly bad for the environment.
In the UK, a fifth of all cars on the road
contain people travelling to and from work. Several major cycling
charities — including Sustrans and the Cycle Touring Club — have
teamed up to provide employers with information on how to draw up
Green Commuter Plans for their employees. Advice is given on access
routes, safe parking, raising awareness among employees, providing
changing facilities and offering incentives to use bicycles and
public transport for business trips.
Poor safety on the road is often mentioned as a
key obstacle to cycling to work. In Nottingham, the Boots Company
plc contributed to a shared cycle/pedestrian path leading to a site
entrance. Other companies in Nottingham have provided money to
improve the city's cycling infrastructure.
Source: Sustrans information
sheet on cycle friendly employers. www.sustrans.org.uk
|
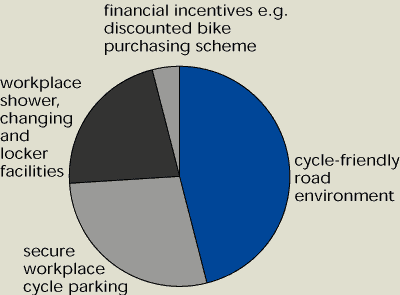
Results of a travel survey in Nottingham of
factors encouraging commuting by bicycle
5.4. Indicator development
This chapter contains some of the 31 indicators
on transport and environment integration being developed within the
EU Transport and Environment Reporting Mechanism (TERM) (EEA,
2000). Improved accuracy and consistency of air emissions estimates
is a priority — particularly for greenhouse gases. Improved
breakdowns by transport mode are still needed for many of the
environmental pressure indicators.
Future work will include improving or adding
TERM indicators on health impacts of air pollution from transport,
traffic noise annoyance, habitat fragmentation, transport prices
and taxes, transport externalities and energy efficiency of
passenger and freight transport. Analysis of the effectiveness of
the use of response measures such as economic instruments (prices,
subsidies, taxes) would also be desirable.
| Table 5.1.
Average annual car-passenger transport per capita |
| Unit: 1 000
passenger-km/capita |
| |
1980 |
1990 |
1992 |
1993 |
1994 |
1995 |
1996 |
1997 |
| Austria |
6.3 |
8.1 |
8.8
|
8.5 |
8.5 |
8.5 |
8.2 |
8.3 |
| Belgium |
6.6 |
8.1 |
8.4 |
8.6 |
8.8 |
9.0 |
9.1 |
9.2
|
| Denmark |
7.4 |
10.4 |
10.9 |
11.1 |
11.4 |
11.7 |
12.1 |
12.4 |
| Finland |
7.1 |
10.3 |
10.0 |
9.8 |
9.7 |
9.8 |
9.8 |
10.0 |
| France |
8.4 |
10.3 |
10.8 |
11.0 |
11.2 |
11.4 |
11.6 |
11.7 |
| Germany |
6.6 |
8.6 |
8.9 |
9.0 |
8.9 |
8.9 |
8.9 |
9.0 |
| Greece |
2.9 |
4.8 |
4.9 |
5.2 |
5.4 |
5.6 |
5.9 |
6.1 |
| Ireland |
8.2 |
10.4 |
10.9 |
11.2 |
11.5 |
11.8 |
12.1 |
12.5 |
| Italy |
5.7 |
9.2 |
10.6 |
10.6 |
10.5 |
10.7 |
10.8 |
11.0 |
| Luxembourg |
7.4 |
10.5 |
11.0 |
11.3 |
11.4 |
11.5 |
11.3 |
11.5 |
| Netherlands |
7.6 |
9.1 |
9.1 |
9.2 |
9.5 |
9.5 |
9.4 |
9.7 |
| Portugal |
4.2 |
6.6 |
7.3 |
8.4 |
9.1 |
10.0 |
10.6 |
11.0 |
| Spain |
5.1 |
7.3 |
7.8 |
8.0 |
8.1 |
8.4 |
8.6 |
8.9 |
| Sweden |
8.0 |
10.5 |
10.6 |
10.4 |
9.6 |
9.9 |
10.5 |
10.6 |
| UK |
7.0 |
10.4 |
10.3 |
10.2 |
10.3 |
10.4 |
10.6 |
10.7 |
| EU |
6.6 |
9.1 |
9.5 |
9.6 |
9.7 |
9.8 |
9.9 |
10.1 |
| Source DG Transport; Eurostat |
5.5. References and further reading
ECMT (1998). Efficient transport for Europe
— policies for internalisation of external costs. European
Conference of Ministers of Transport, Paris.
ECMT (1999): Efficient transport taxes:
international comparison of the taxation of freight and passenger
transport by road and rail. (In preparation). Paris.
EEA (1999). Environment in the European
Union at the turn of the century. European Environment Agency,
Copenhagen.
EEA (2000). Are we moving in the right
direction? Indicators on transport and environment integration in
the EU. (In preparation). European Environment Agency,
Copenhagen.
European Commission (1995). Towards fair
and efficient pricing in transport. (COM(95)691. European
Commission, Brussels.
European Commission (1998). The Common
Transport Policy — sustainable mobility: perspective for the
future. European Commission, Brussels.


Document Actions
Share with others