4. DISCUSSION
4.1 Geographic
coverage of monitoring stations
For 1995 information for 858 stations has
been received; for nearly all of them (855) geographical
coordinates are available. For the interpretation of ozone data
it is essential to have an indication of the direct surroundings
of the station as the ozone concentration may be strongly
influenced by local conditions. For example, the ozone
concentrations may be scavenged by locally emitted nitrogen
oxides or by enhanced dry deposition as might be the case under a
forest canopy; see Annex II for a brief discussion on ozone
phenomenology. For 725 stations (85%) information on immediate
surroundings is available.
According to the submitted information on
station type and characteristics, a distinction between
background (or rural), urban, street and other stations has been
made, see Table 6. Map 2 shows the location of background
monitoring stations. Tentatively, the area for which the
measurements at these stations are assumed to be representative
is indicated with a circle using a radius of 100 km. This
"radius of representativeness" might be different for
the various regions in Europe - it might even depend on the wind
direction - and should be based on more detailed analysis of the
ozone phenomenology at the stations. Although the identification
of the background stations is by far from complete and the radius
of representativeness may differ from the assumed 100 km, Map 2
suggests that the present set of stations covers 40 to 50% of the
land area of the EU. As is shown in Map 2 the geographical
coverage of background stations is rather adequate in North-West
Europe but in other regions, in particular in France, Italy and
Greece, gaps are noted.
Table 6. Classification of ozone
stations according to their direct surroundings as rural, urban,
or street station;. 'other' indicates both other station types
(e.g. in industrial areas) and stations for which no information
of station type is available.
| MS |
Rural |
Urban |
Street |
Other/Unknown |
| AT |
59 |
34 |
12 |
5 |
| BE |
12 |
7 |
0 |
1 |
| DE |
95 |
166 |
47 |
34 |
| DK |
3 |
3 |
0 |
0 |
| ES |
13 |
6 |
52 |
15 |
| FI |
9 |
1 |
1 |
0 |
| FR |
0 |
0 |
0 |
110 |
| GB |
13 |
2 |
0 |
17 |
| GR |
0 |
6 |
4 |
0 |
| IE |
3 |
1 |
0 |
2 |
| IT |
7 |
33 |
6 |
22 |
| LU |
2 |
0 |
3 |
0 |
| NL |
26 |
3 |
8 |
0 |
| PT |
1 |
1 |
4 |
3 |
| SE |
6 |
0 |
0 |
0 |
| EU |
249 |
263 |
137 |
209 |
|
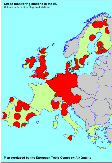 |
Map 2. Location of
background ozone monitoring stations. Tentatively the
area for which the ozone measurements might be
representative is indicated with a circle with a radius
of 100 km. |
It has been attempted to quantify the
coverage of the monitoring stations for urban areas as is
relevant for population exposure. According to information
obtained from the Eurostat population database, there are in the
EU about 2000 cities with more than 25 000 inhabitants. It is
estimated that from a total EU population of c. 362
million, c. 195 million people live in these cities with
more than 25 000 inhabitants. Summation of the number of
inhabitants of all the cities in which at least one ozone station
is operational and has been reported to the EC in 1995, leads to
a total of approximately 58 million, that is, only for 30% of the
total urban population (equivalent to 16% of the total EU
population) an estimate of ozone exposure can be made.
Although the uncertainties in the present
set of station descriptions and the large number of stations for
which a description of immediate surrounding is lacking preclude
any firm conclusion, it is clear that the set of urban stations
in the national networks is not representative for the total
urban population in the EU. Conclusions concerning the exposure
of urban population to high ozone levels should therefore be seen
as tentative.


Document Actions
Share with others