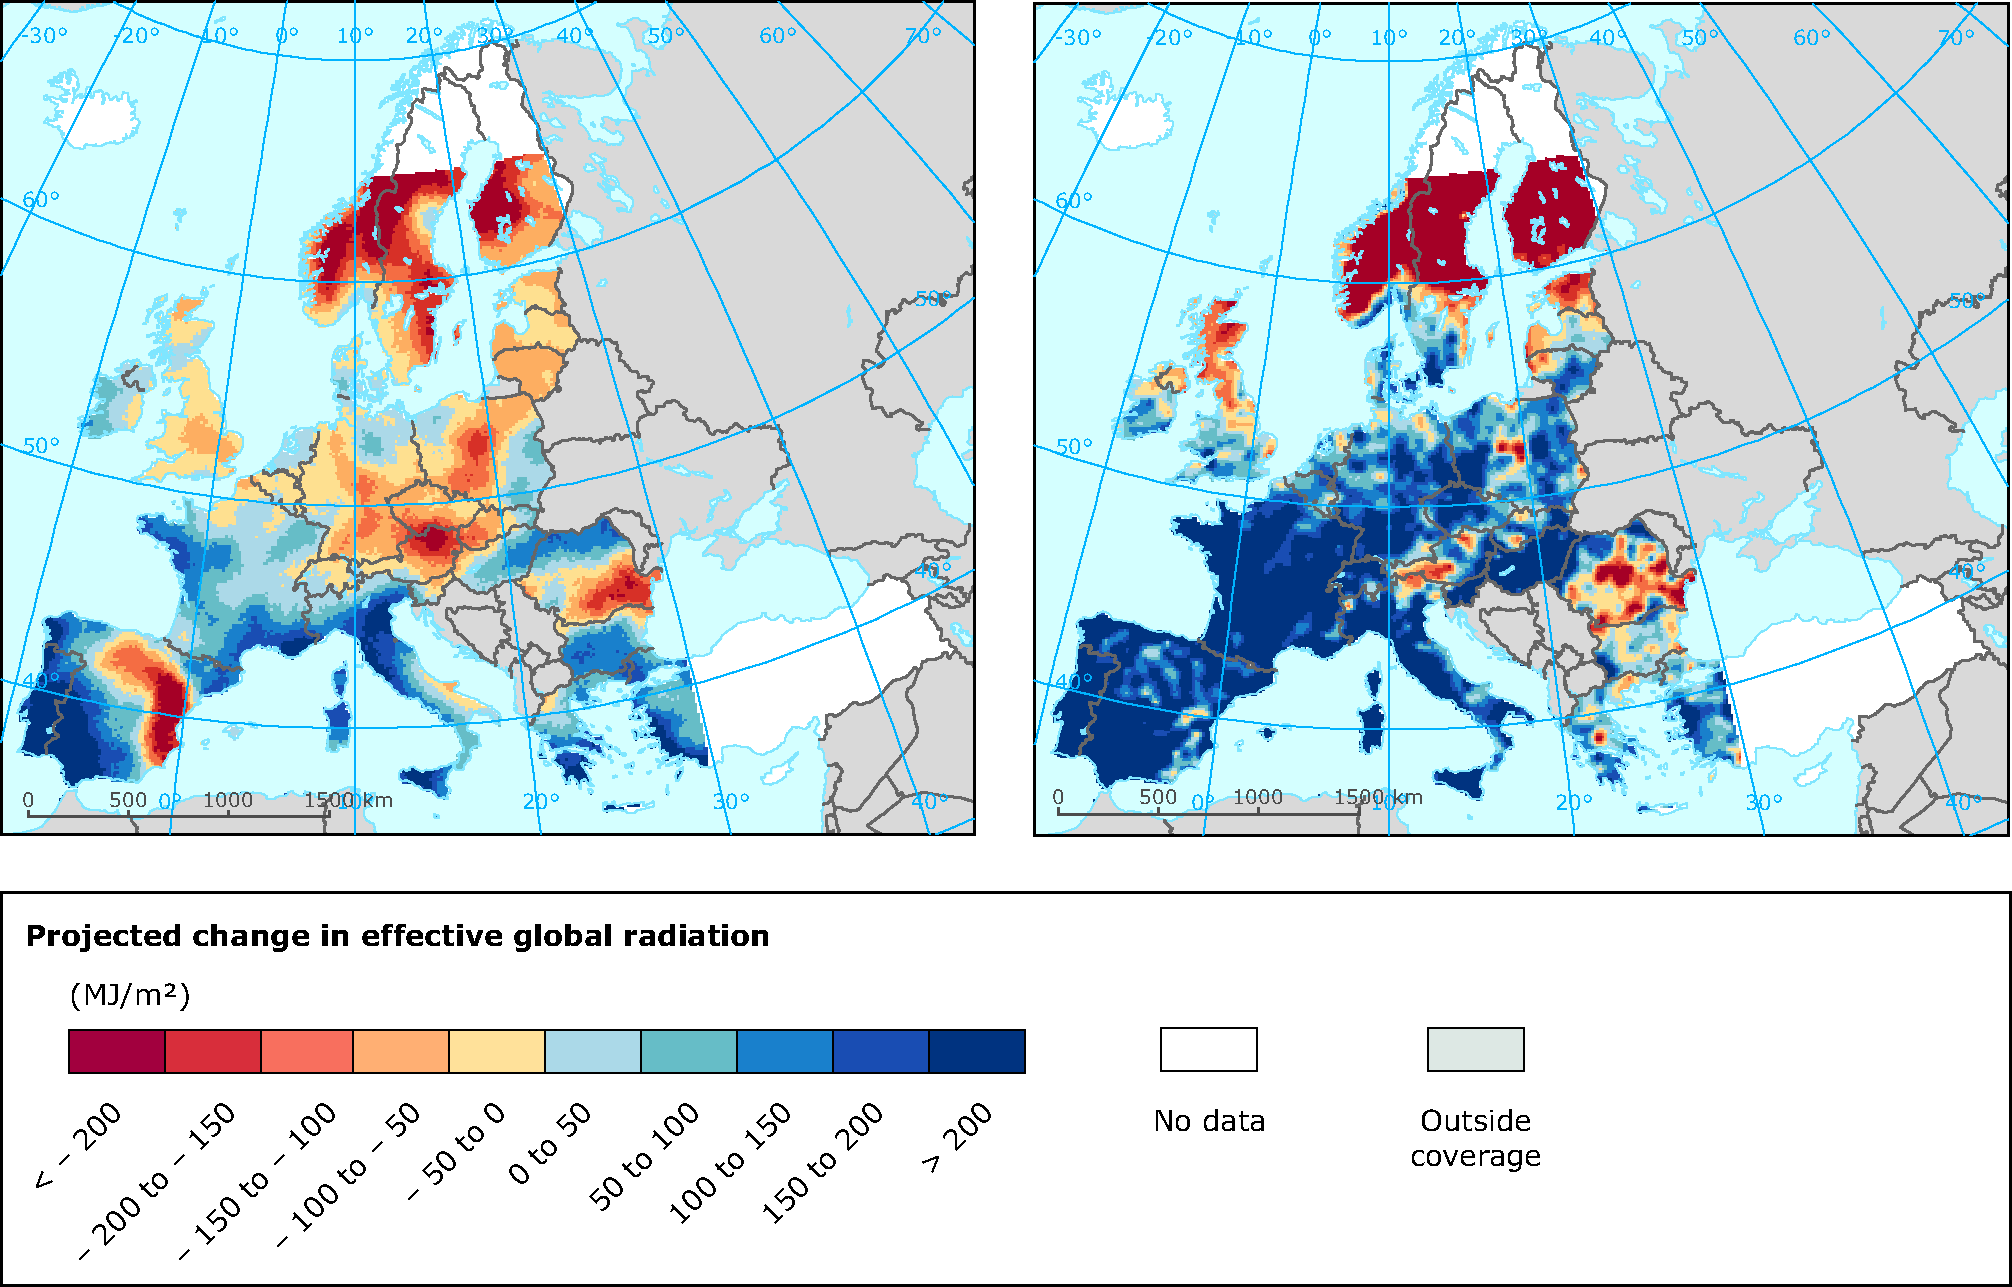
The index of effective solar radiation sum has been developed as a proxy for the effects of environmental changes on crop productivity, and it integrates the daily solar radiation on those days where neither temperature nor soil moisture is limiting for growth. This index estimates the potential for rain-fed crop production using a standard soil across the entire continent, although this may be greatly modified by local soil conditions.
Olesen, J.E., Børgensen, C. D., Elsgaard, L., Palosuo, T., Rötter, R., Skjelvåg, A. O., Peltonen-Sainio, P., Börjesson, T., Trnka, M., Ewert, F., Siebert, S., Brisson, N., Eitzinger, J., van der Fels-Klerx, H. J. and van Asselt, E., 2012, 'Changes in flowing and maturity time of cereals in Northern Europe under climate change', Food Additives and Contaminants, in press


Document Actions
Share with others