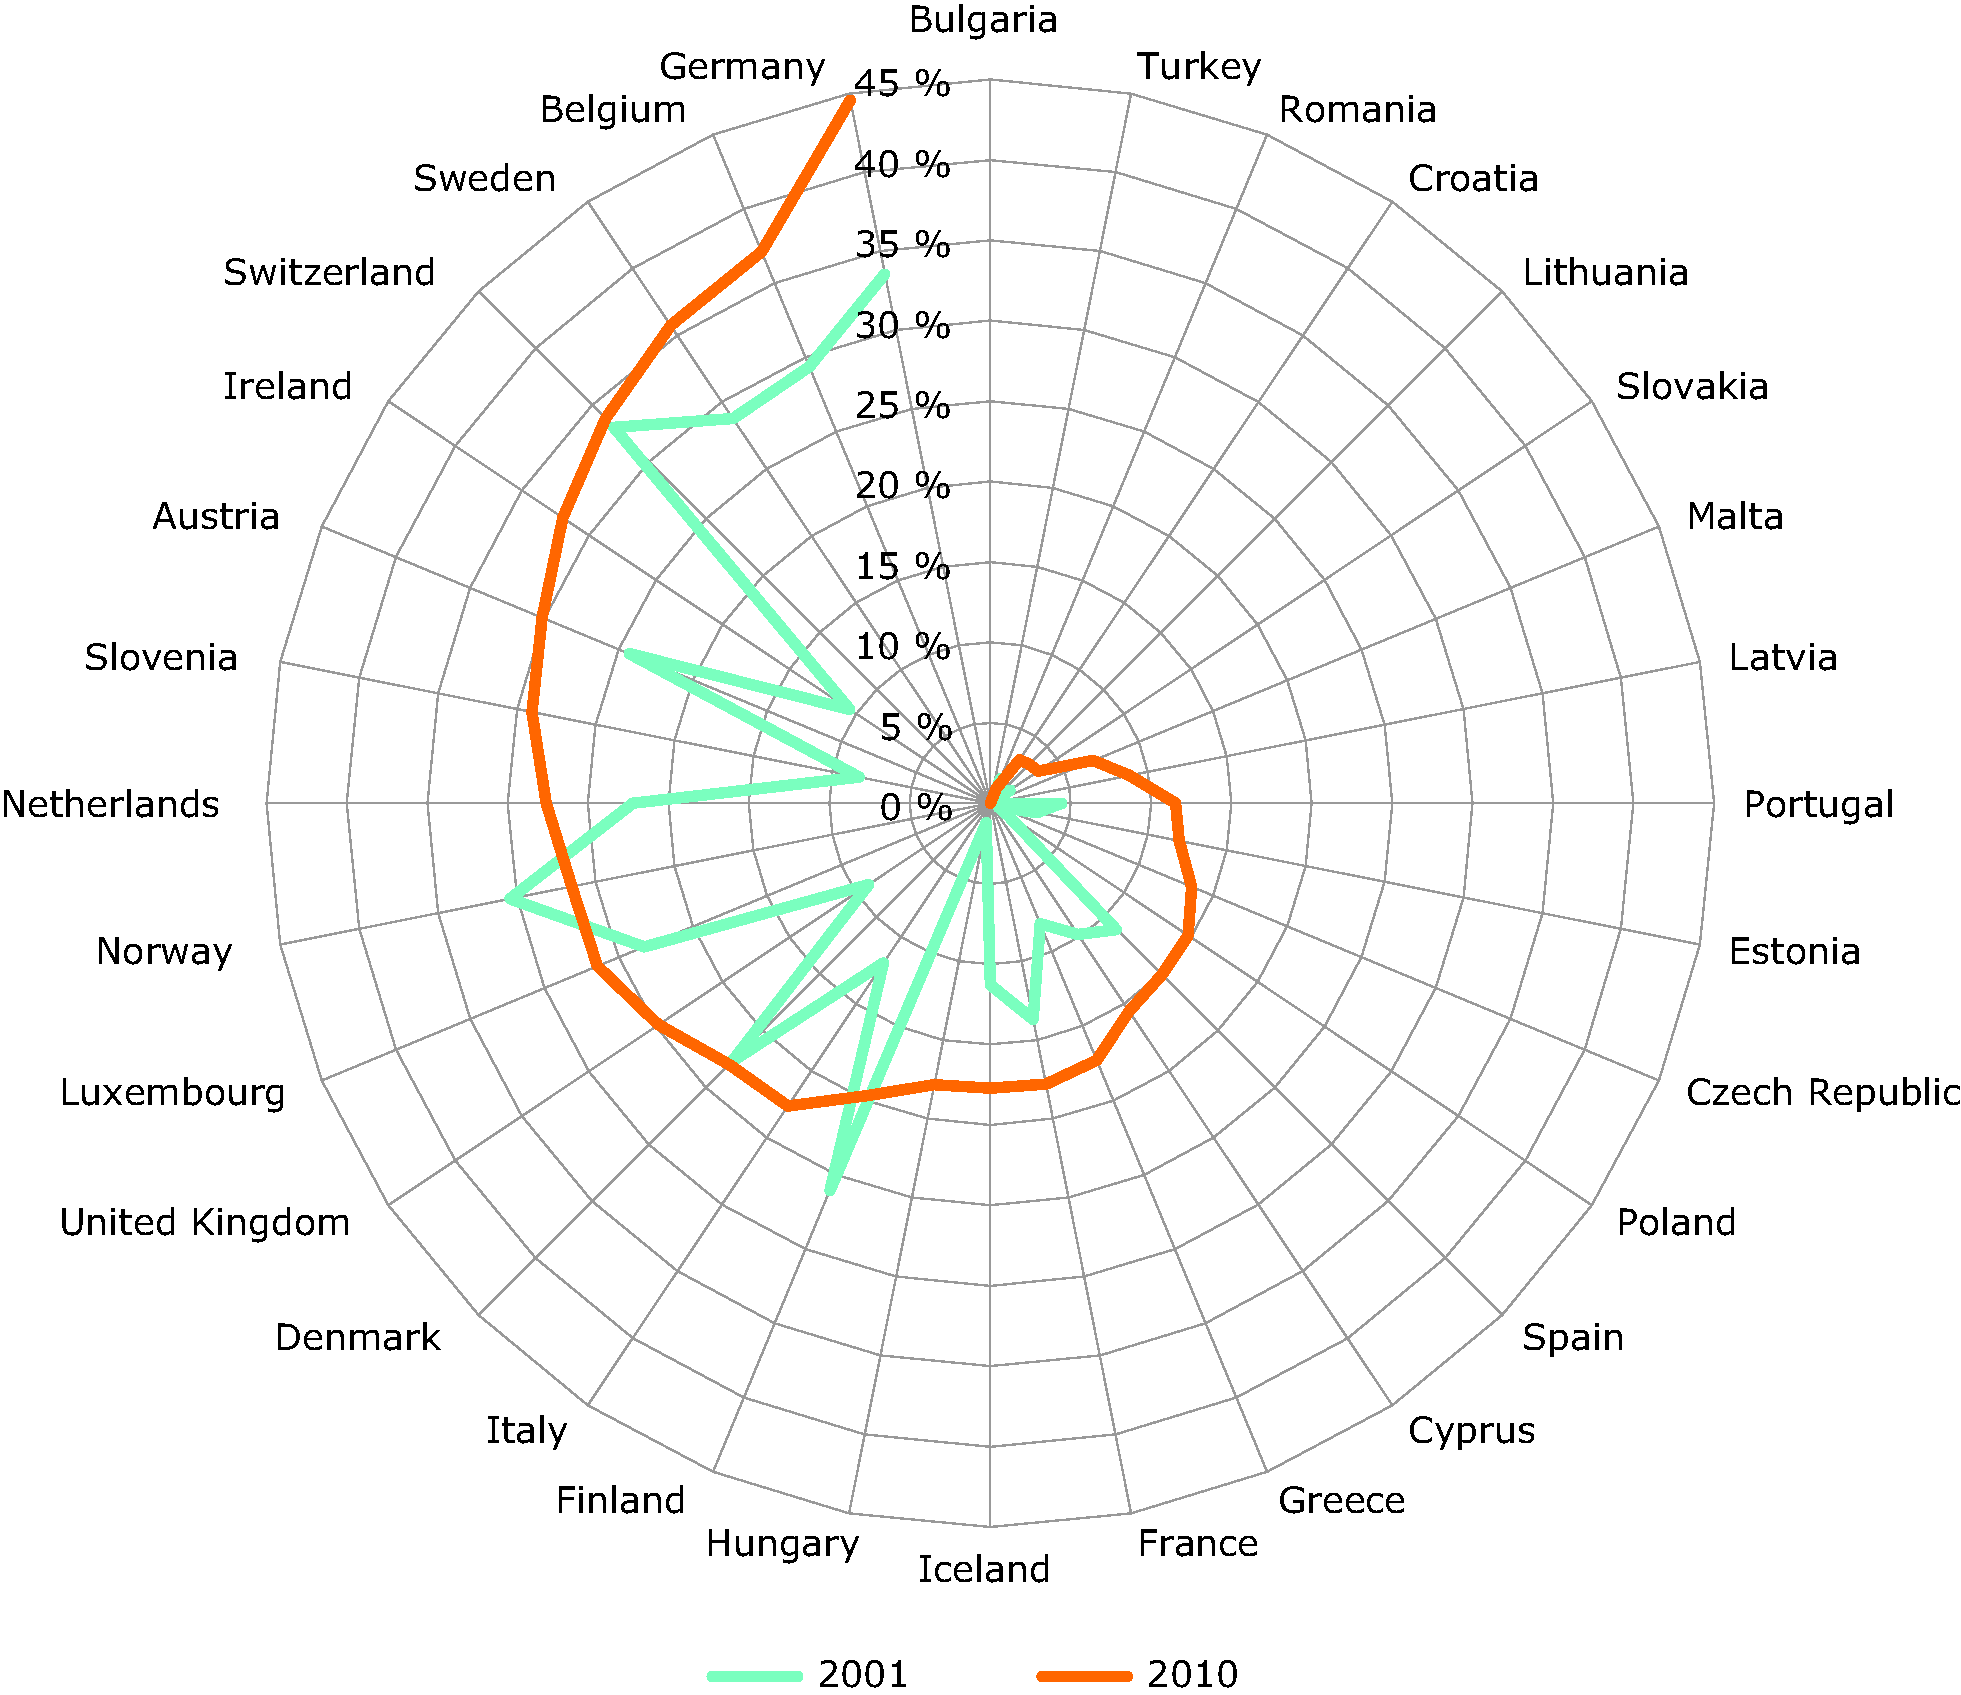
Notes: The further from the centre in the radar chart, the better the waste management. The material recycling rate is calculated as the percentage of materials recycled per MSW generated. According to Eurostat the comparability of the data over time is high. However, some breaks in the time series are documented, which can influence the comparability between countries and within a country. Generally, the quality of the data seems to better in the end of the period between 2001 and 2010 than in the beginning. For Iceland is used 2008 data for 2010. For Slovenia 2002 data are used for 2001 and 2009 data are used for 2010. Croatia is not included for 2001.


Document Actions
Share with others