Indicator 21: Specific emissions
- Data from Austria and the Netherlands shows that
specific emissions of air pollutants (CO, NOx and NMVOC) from transport
have fallen significantly during the past two decades. The mandatory use of
catalytic converters since the late 1980s has markedly reduced emissions from
passenger cars.
- However, emission efficiency depends on country-specific
characteristics such as the composition of the car fleet and maintenance levels,
so these two national examples may not be typical of the EU.
Figure 6.5: Specific NOx emissions
by mode (Austria)
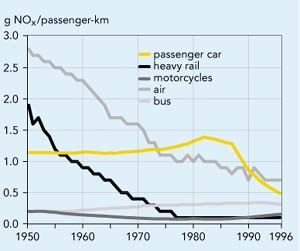
Source: Federal Ministry for the Environment, Youth
and Family (Austria, 1997)
Objective
Reduce
emissions per transport unit (passenger-km or tonne-km).
Definition
Emissions of air pollutants per transport
unit, distinguishing between type (freight or passenger), mode and vehicle category.
Policy and targets
Air pollution is one of the main environmental
consequences of transport use and reducing specific emissions (emissions per
transport unit) is an important aim of air pollution abatement policies. The
policy framework for this indicator is described in Indicator 2. The principal
elements are:
- Directives that set emission standards for petrol
and diesel passenger cars, buses and lorries, ships and aircraft (see also
Indicators 2 and 26).
- The Auto-Oil I Programme and the resulting Directives
on emission standards for cars, phase-out of leaded fuels and fuel quality,
adopted in 1998 and 1999 (98/69/EC, 98/70/EC and 99/12/EC). The follow-up
programme (Auto-Oil II) is expected to result in new proposals by the beginning
of 2000.
- Most Community legislation dealing with gaseous
and noise emission standards for aircraft are based on standards set by
the International Civil Aviation Organisation (ICAO).
- Under the International Convention for the Prevention
of Pollution from Ships (MARPOL), a new protocol to reduce pollution emissions
(NOx, SO2) from ships was proposed in 1997, but this
has not yet been adopted.
Findings
Since no EU-wide data is available, this assessment
is based mainly on data from Austria and the Netherlands. Although this data
probably indicates general trends, caution is needed when extrapolating the
findings to other countries. Specific emissions depend on factors such as
the composition of the car fleet and the level of maintenance, which vary
significantly between countries. In particular, Austria and the Netherlands
have the highest penetration of catalytic converters.
The Austrian data (Figure 6.6) shows a dramatic reduction
in NOx, NMVOC and particulate matter emissions per passenger-km
for air and heavy rail during 1950-1980. The reduction for heavy rail emissions
is due mainly to electrification and the use of hydropower. Specific emissions
from passenger cars fell significantly (60 %) during the 1990s, mainly
as a result of the introduction of catalytic converters. Specific emissions
of NMVOC from motorcycles (2-wheelers) on the other hand, increased markedly
during the 1960s and fell again only in the early 1990s. Motorcycles still
have very high specific emissions.
Figure 6.6: Air
emissions per passenger-kilometre and per tonne-kilometre by mode (Austria,
1950-1996)
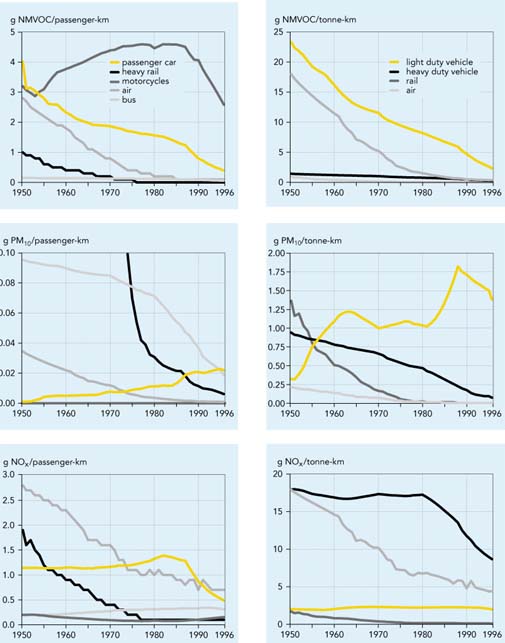
Source:
Federal Ministry for the Environment, Youth and Family (Austria, 1997)
A similar pattern is seen in the Netherlands for 1980-1997
(Figure 6.7). The reductions resulted from ever-stricter emission regulations
(particularly for diesel vehicles), improvements in fuel efficiency and fuel
quality and, most importantly, the mandatory use of catalytic converters on
new petrol cars.
Figure 6.7: Air emissions per vehicle-kilometre
- road vehicles (the Netherlands, 1980-1997)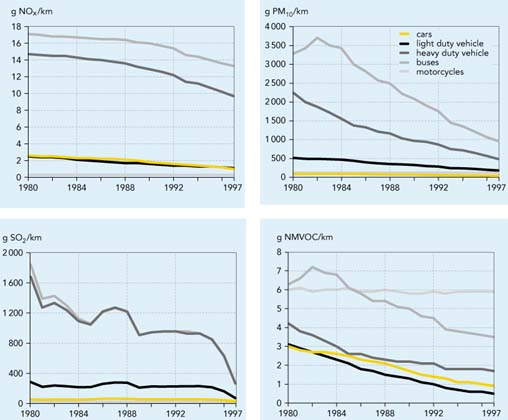
Source: Dutch National Institute of Public Health
and the Environment (Bilthoven, 1998)
Future work
- More work is needed to provide data at the EU level.
The joint DG-TransportEurostat TRENDS project (Transport and Environment
Database System), see Box 6.4, and a number of research projects under the
Commissions transport RTD programme (in particular the MEET project, Methodologies
for Estimating Air Pollutant Emissions from Transport and its follow-up)
are expected to produce time-series data on specific emissions for road,
rail, sea and air.
- An indicator on primary emission intensities would
provide a better basis for comparing modes. This would require a life-cycle
analysis to take account of energy used and emissions generated by the production
of electricity and fuels, and by the production and disposal of vehicles.
This would, however, require extensive methodological development and data
collection. An example of such an analysis is given in Box 6.3.
|
Box 6.3: Environmental balance of transport in Austria
An example of an indicator report where life-cycle analysis has (to
a certain extent) been applied is the environmental balance of transport
in Austria. In this analysis the major environmental impacts are related
to the operation process as well as to the production of fuel process.
The indirect environmental impacts caused by the maintenance and the
production of vehicles, and the construction and operation of infrastructure
(e.g. road lighting), usually constitute less than 20 % of the
total environmental impact of transport.
Figure 6.8: Emissions of NOx per passenger-km and
for the various process steps (Austria, 1995)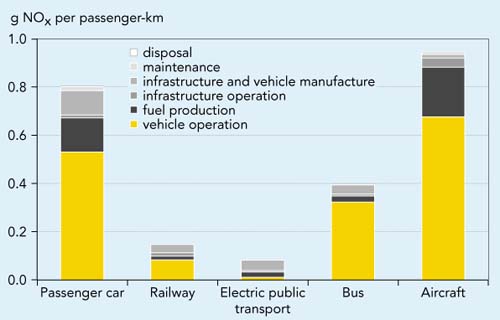
Source:
Federal Ministry for the Environment, Youth and Family (Vienna, 1997)
|
|
Box 6.4: Transport and Environment Database
System (TRENDS)
Eurostat and DG Transport are jointly developing
a database system (TRENDS) that links transport and other data with
methodologies for estimating emissions and other environmental pressures.
An important aim is to produce a consistent set of estimates to be used
for EU policy purposes including TERM. Both absolute and specific emissions
will be calculated. TRENDS will enable the effects of specific policy
measures on emissions and other environmental pressures to be monitored.
By linking calculated emissions to transport
statistics it will be possible to estimate emissions from different
types of transport, e.g. vehicle type, passenger/goods, national/international/transit,
inter-regional flows, origin/destination, type of goods and mode. It
will also be possible to estimate emissions per vehicle-km, passenger-km
or tonne-km, enabling comparisons between environmental efficiencies
in different places and over time.
Forecasts are currently based on projections
of past trends, combined with prediction of social and technological
developments. By bringing estimates for all modes into a single system,
it will be possible to calculate the effects of modal changes on overall
emissions, such as shifting a given tonnage of freight from roads to
water. Policy-makers will be able to identify the most environmentally
damaging components of the transport system and compare the probable
outcomes of different policies. TRENDS is now being developed as a tool
to assist in producing many of the TERM indicators.
The figure below provides some preliminary results
showing typical emissions of NOx per passenger-km. A range
of values is provided for each means of transport, based on operating
conditions and occupancy rates.
Member States also prepare detailed estimates
and projections of transport emissions for policy making, monitoring
and evaluating the effect of policies and measures, and reporting according
to international emission-reduction obligations. These estimates need
to be improved, and comparison with TRENDS estimates could help to identify
and remove gaps and inconsistencies. Member States are increasingly
using COPERT3, a software tool developed and distributed by the EEA
in 1999, to estimate emissions from road transport. COPERT3 uses methodologies
developed by the MEET project (Methodologies for estimating emissions
from transport), an international collaboration targeted particularly
on newer types of vehicle, non-road transport, and future emissions,
which was finalised in 1999. TRENDS also uses MEET, and COPERT3 and
TRENDS are therefore fully compatible.
The results of the comparisons should be communicated
to Member States to improve the consistency, transparency, comparability
and reliability of national and also of TRENDS estimates.
Figure 6.9: Estimated NOx emissions per passenger-km
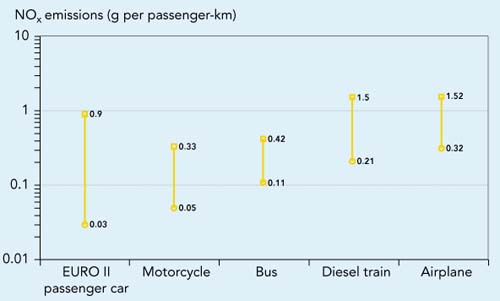
Source: Eurostat
|
|
Data
Emission efficiency of passenger transport in Austria
Unit: gram NOx NMVOC/ pasenger-km
|
|
|
Road (passenger car)
|
Road (bus)
|
Rail
|
Air
|
|
Year
|
NMVOC
|
NOx
|
NMVOC
|
NOx
|
NMVOC
|
NOx
|
NMVOC
|
NOx
|
|
1970
|
1.87
|
1.16
|
0.134
|
0.271
|
0.152
|
0.389
|
0.810
|
1.582
|
|
1975
|
1.69
|
1.20
|
0.126
|
0.298
|
0.058
|
0.220
|
0.388
|
1.120
|
|
1980
|
1.57
|
1.32
|
0.120
|
0.310
|
0.025
|
0.135
|
0.235
|
1.044
|
|
1985
|
1.35
|
1.33
|
0.107
|
0.323
|
0.022
|
0.133
|
0.138
|
0.939
|
|
1990
|
0.79
|
0.87
|
0.090
|
0.333
|
0.015
|
0.101
|
0.073
|
0.739
|
|
1991
|
0.72
|
0.79
|
0.083
|
0.339
|
0.015
|
0.102
|
0.081
|
0.891
|
|
1992
|
0.63
|
0.69
|
0.078
|
0.339
|
0.015
|
0.102
|
0.068
|
0.755
|
|
1993
|
0.56
|
0.63
|
0.073
|
0.338
|
0.014
|
0.100
|
0.065
|
0.727
|
|
1994
|
0.49
|
0.57
|
0.068
|
0.331
|
0.013
|
0.094
|
0.063
|
0.706
|
|
1995
|
0.44
|
0.53
|
0.063
|
0.323
|
0.012
|
0.084
|
0.060
|
0.675
|
|
1996
|
0.39
|
0.49
|
0.059
|
0.313
|
0.011
|
0.075
|
0.060
|
0.675
|
|
Source: Federal Ministry for the Environment, Youth
and Family (Austria, 1997)
|
Emission efficiency of freight transport in Austria
Unit: gram NOx NMVOC/ tonne-km
|
|
Road (HDV)
|
Rail
|
Inland waterways
|
Air
|
|
|
Year
|
NMVOC
|
NOx
|
NMVOC
|
NOx
|
NMVOC
|
NOx
|
NMVOC
|
NOx
|
|
1970
|
1.03
|
17.40
|
0.136
|
0.348
|
0.039
|
0.286
|
5.24
|
10.23
|
|
1975
|
0.87
|
17.18
|
0.051
|
0.197
|
0.036
|
0.286
|
2.51
|
7.24
|
|
1980
|
0.78
|
17.32
|
0.022
|
0.121
|
0.033
|
0.286
|
1.52
|
6.75
|
|
1985
|
0.65
|
15.17
|
0.020
|
0.119
|
0.031
|
0.287
|
0.89
|
6.07
|
|
1990
|
0.48
|
11.80
|
0.014
|
0.091
|
0.029
|
0.288
|
0.47
|
4.78
|
|
1991
|
0.42
|
11.22
|
0.013
|
0.091
|
0.028
|
0.289
|
0.52
|
5.76
|
|
1992
|
0.38
|
10.44
|
0.013
|
0.091
|
0.027
|
0.283
|
0.44
|
4.88
|
|
1993
|
0.36
|
9.92
|
0.013
|
0.090
|
0.027
|
0.279
|
0.42
|
4.70
|
|
1994
|
0.32
|
9.41
|
0.012
|
0.084
|
0.026
|
0.274
|
0.41
|
4.57
|
|
1995
|
0.30
|
8.98
|
0.011
|
0.075
|
0.025
|
0.269
|
0.39
|
4.37
|
|
1996
|
0.27
|
8.68
|
0.009
|
0.067
|
0.025
|
0.264
|
0.39
|
4.36
|
|
Source: Federal Ministry
for the Environment, Youth and Family (Austria, 1997)
|

Document Actions
Share with others