Indicator 22-23: Vehicle utilisation
- According to national surveys, the occupancy
rates of passenger cars are falling steadily, mostly as a result of
the continued drop in household size and increases in car ownership.
- Load factors of trucks vary from 47 %
for Denmark to 63 % for the UK (excluding empty trips), indicating
that better vehicle utilisation can lead to significant efficiency gains.
Empty hauling makes up on average 30 % of total truck vehicle-km.
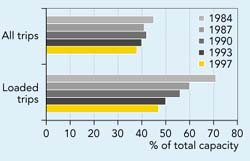
Figure 6.10: Load factor for trucks over 6 tonnes
1984-1996 (Denmark)
Source:Statistics
Denmark (Denmark, 1995)
Objective
Increase
vehicle occupancy and load factors.
Definition
- Occupancy rate: average number of passengers
in a vehicle (cars, buses, trains, aircraft).
- Load factor: ratio of the average load to total
vehicle freight capacity in tonnes (vans, trucks, train wagons, ships).
- Empty haulage: percentage of truck-km run empty.
|
Policy and targets
Utilisation efficiency is one of the main parameters
that determine energy and emission efficiency. A high occupancy rate in passenger
cars and buses has relatively little impact on overall vehicle weight, and
therefore on energy consumption. For freight, the relationship is more complex,
as a higher load factor is likely to result in a significant increase in vehicle
weight and therefore in more energy use and emissions. High load factors are
still preferable, however, since low load factors imply a higher number of
transport movements, which is generally more environmentally damaging.
Measures to increase occupancy rates include schemes
for favouring vehicles with more than one passenger (through-traffic privileges)
and initiatives to promote car-sharing. Private companies are increasingly
promoting car-sharing. There are no targets for these indicators at the EU
level. Sweden has adopted targets for increasing the average number
of people in private cars by 5 % and the load factor of lorries by 3 %
by 2000 (base year 1995) (ERM, 1999).
Changes in loading and utilisation can have a significant
impact on the overall efficiency of freight transport: a heavy truck when
fully loaded (say with 40 tonnes) uses about one-eighth of the fuel per tonne-km
of a light delivery truck carrying 200 kg. Load factors can also be optimised
by tailoring vehicles more closely to particular types of delivery operations
with the help of IT systems for fleet management. These can also support improved
route guidance, scheduling operations, return load management, vehicle performance
and driver behaviour. (OECD/ECMT, 1999)
Findings
Occupancy rates
Data on trends in occupancy rates is limited. According to the IEA, occupancy
rates of passenger cars in Europe fell from 2.0-2.1 in the early 1970s to 1.5-1.6
in the early 1990s. The decrease is a result of increasing car ownership, extended
use of cars for commuting and a continued decline in household size. Progress
with car sharing is discussed in Box 6.5.
Car occupancy rates also vary for urban
and long-distance trips (1.3 and 1.8 passengers per car, respectively) and travel
purpose (Table 6.1).
|
Table 6.1: Occupancy rates by travel
purpose in Europe
|
|
Travel purpose
|
Occupancy rate (passengers per vehicle)
|
|
Commuting to/from work
|
1.1-1.2
|
|
Family trip
|
1.4-1.7
|
|
Travel and leisure
|
1.6-2.0
|
|
Source: IEA, 1997
|
Conversely, the occupancy of aeroplanes has risen since
1970 in most European countries; European flights (international and domestic)
are now about 70 % full, compared to 50 % in 1970 (ICAO, 1999). Conventional
passenger trains are on average 35 % full, while the occupancy rate of
high-speed trains is generally higher, varying for different countries and connections
(e.g. about 80 % for the TGV Paris-Lyon, about 50 % on average for
the German ICE).
|
Box 6.5: Car sharing some
examples
Car sharing can reduce the number
of cars and help to achieve a more efficient use of each car, because
the cars are unused for shorter periods and have a higher average occupancy
rate. The linkage between increasing car ownership and increasing transport
volumes is thereby reduced.
Car sharing is becoming more and
more popular across Europe, benefiting the participants financially
and the environment. The ECS (European Car Sharing) network, founded
in 1980, now includes 40 organisations in 350 cities in Germany, Austria,
Switzerland and the Netherlands, and initiatives are being developed
in the United Kingdom and Sweden.
StattAuto Car Sharing GmbH, established
in 1988 and operating in Berlin, has about 3 600 members and the number
is gradually increasing. The car fleet consists of 180 vehicles travelling
an average of 34 000 km a year compared with 14 500 km for the
average German car. Most trips (77 %) last less than 24 hours and
56 % of the trips are between 20 and 100 km. The average annual
mileage of StattAuto users is 4 000 km per person compared with
8 700 km per person per year for non-users. The average occupancy rate
of StattAuto cars is two persons, compared with the German average of
1.3 persons.
Source: StattAuto GmbH
|
Load factors
No EU-wide data is available on freight load factors.
The country figures used in this assessment may not be representative for
the whole EU, but indicate the type of data that is relevant.
UK statistics show that load factors (excluding empty
running) remained fairly stable at around 63 % between 1986 and 1996
(DETR, 1998).
In Denmark, load factors for loaded trips fell from
over 70 % in 1984 to 47 % in 1996, and for all trips (including
empty running) from 45 % to 38 % (see Figure 6.10). This smaller
reduction is caused by reductions in the share of vehicle-km running empty,
which fell from 29 % in 1984 to 17 % in 1996. The decrease in load
factors is the result of the combined effect of increases in the loading capacity
per truck and reductions in the weight transported per trip probably due to
declining densities of modern high-quality goods. Increasing demand for just-in-time
deliveries of high-value goods, together with relatively low transport costs,
gives companies an economic incentive to prioritise fast deliveries above
a more efficient capacity utilisation.
EU-wide data on empty hauling is not available either,
but a few country examples indicate that there are large differences. Empty
hauling makes up only 25 % of total truck vehicle-km in Germany and over
40 % in the Netherlands. In the UK, the proportion of empty runs declined
from about 33 % to 29 % between 1980 and 1996. This trend may be
explained by the lengthening of truck journeys, an increase in the number
of drops per trip, the expansion of load-matching services, a growth in the
reverse flow of packaging material / handling equipment and greater efforts
by shippers to obtain return loads (McKinnon, 1999).
Future work
- More work is needed to provide reliable and comparable
data for occupancy rates and load factors for all modes in general and for
rail, sea and air transport in particular. Member States recently adopted
a Council regulation (EC) No 1172/98) on statistical returns in respect
of the carriage of goods by road, in which they undertook to compile statistics
according to standardised guidelines. Eurostat expects that this regulation
will yield comprehensive data on freight vehicle utilisation by the beginning
of 2000.
- Occupancy rates for passenger cars differ considerably,
depending on the length and purpose of the trip. Breakdowns by purpose (work/education,
business, shopping, leisure and holidays) are therefore needed.
- More work is also needed to develop a better indicator
of freight vehicle utilisation. The volume of goods carried is progressively
becoming more important as truck space is often filled long before the maximum
permitted weight is reached. Weight-based load factors therefore tend to
underestimate the true level of utilisation.
- Further work may also be needed to ensure that
empty hauling is dealt with in comparable ways in national statistics.
Data
average occupancy rates of conventional trains
Unit: percentage of
passenger seats occupied
|
| |
Railway company
|
1996
|
1997
|
|
Germany
|
DB AG
|
47.2
|
44.8
|
|
Italy
|
FS SpA
|
46.4
|
43.9
|
|
Netherlands
|
NS
|
33.3
|
45.6
|
|
Spain
|
RENFE
|
62.6
|
61.1
|
|
Sweden
|
SJ
|
43.5
|
51.9
|
|
Belgium
|
SNCB/NMBS
|
43.7
|
47.6
|
|
France
|
SNCF
|
57.2
|
58.5
|
|
Finland
|
VR
|
34.8
|
39.2
|
|
Source; UIC, 1997
|
Data
Examples of average occupancy rates of passenger cars
Unit: average number of passengers per car |
|
Member State
|
Passengers per car
|
|
Denmark
|
1.68
|
|
The Netherlands
|
1.38
|
|
Sweden (urban)
|
1.70
|
|
Sweden (rural)
|
2.00
|
|
United Kingdom
|
1.66
|
|
Source: The Danish Ministry of Transport, 1995
|
|
Average occupancy rates of high-speed trains 1996-97
Unit: percentage of passenger seats occupied
|
|
Traffic type
|
Link
|
Occupancy rate %
|
|
Urban transport
(dominant rush hours)
|
Urban train (Copenhagen)
typical value
|
28
30
|
|
Regional transport/ InterRegio (IR)
|
West Link (Denmark)
East Link (Denmark)
Typical value
|
37
39
40
|
|
Intercity (IC)/ International (EC)
|
Danish InterCity links
German IC average
Danish international traffic
German EC average
Typical value
|
56
41.1
45
45.2
50
|
| Source:
MEET deliverable Nr 24, (intermodal comparisons of atmospheric pollutant
emissions) |
|
Scheduled airline traffic (international
and domestic) average occupancy rates
Unit: percentage
of passenger seats occupied
|
| |
1997
|
|
Austria
|
66 %
|
|
Belgium
|
66 %
|
|
Denmark
|
60 %
|
|
Finland
|
67 %
|
|
France
|
74 %
|
|
Germany
|
73 %
|
|
Greece
|
68 %
|
|
Ireland
|
74 %
|
|
Italy
|
71 %
|
|
Luxembourg
|
48 %
|
|
Netherlands
|
78 %
|
|
Portugal
|
70 %
|
|
Spain
|
71 %
|
|
Sweden
|
64 %
|
|
United Kingdom
|
72 %
|
| EU15 |
68 %
|
|
Source: ICAO 1999
|

Document Actions
Share with others