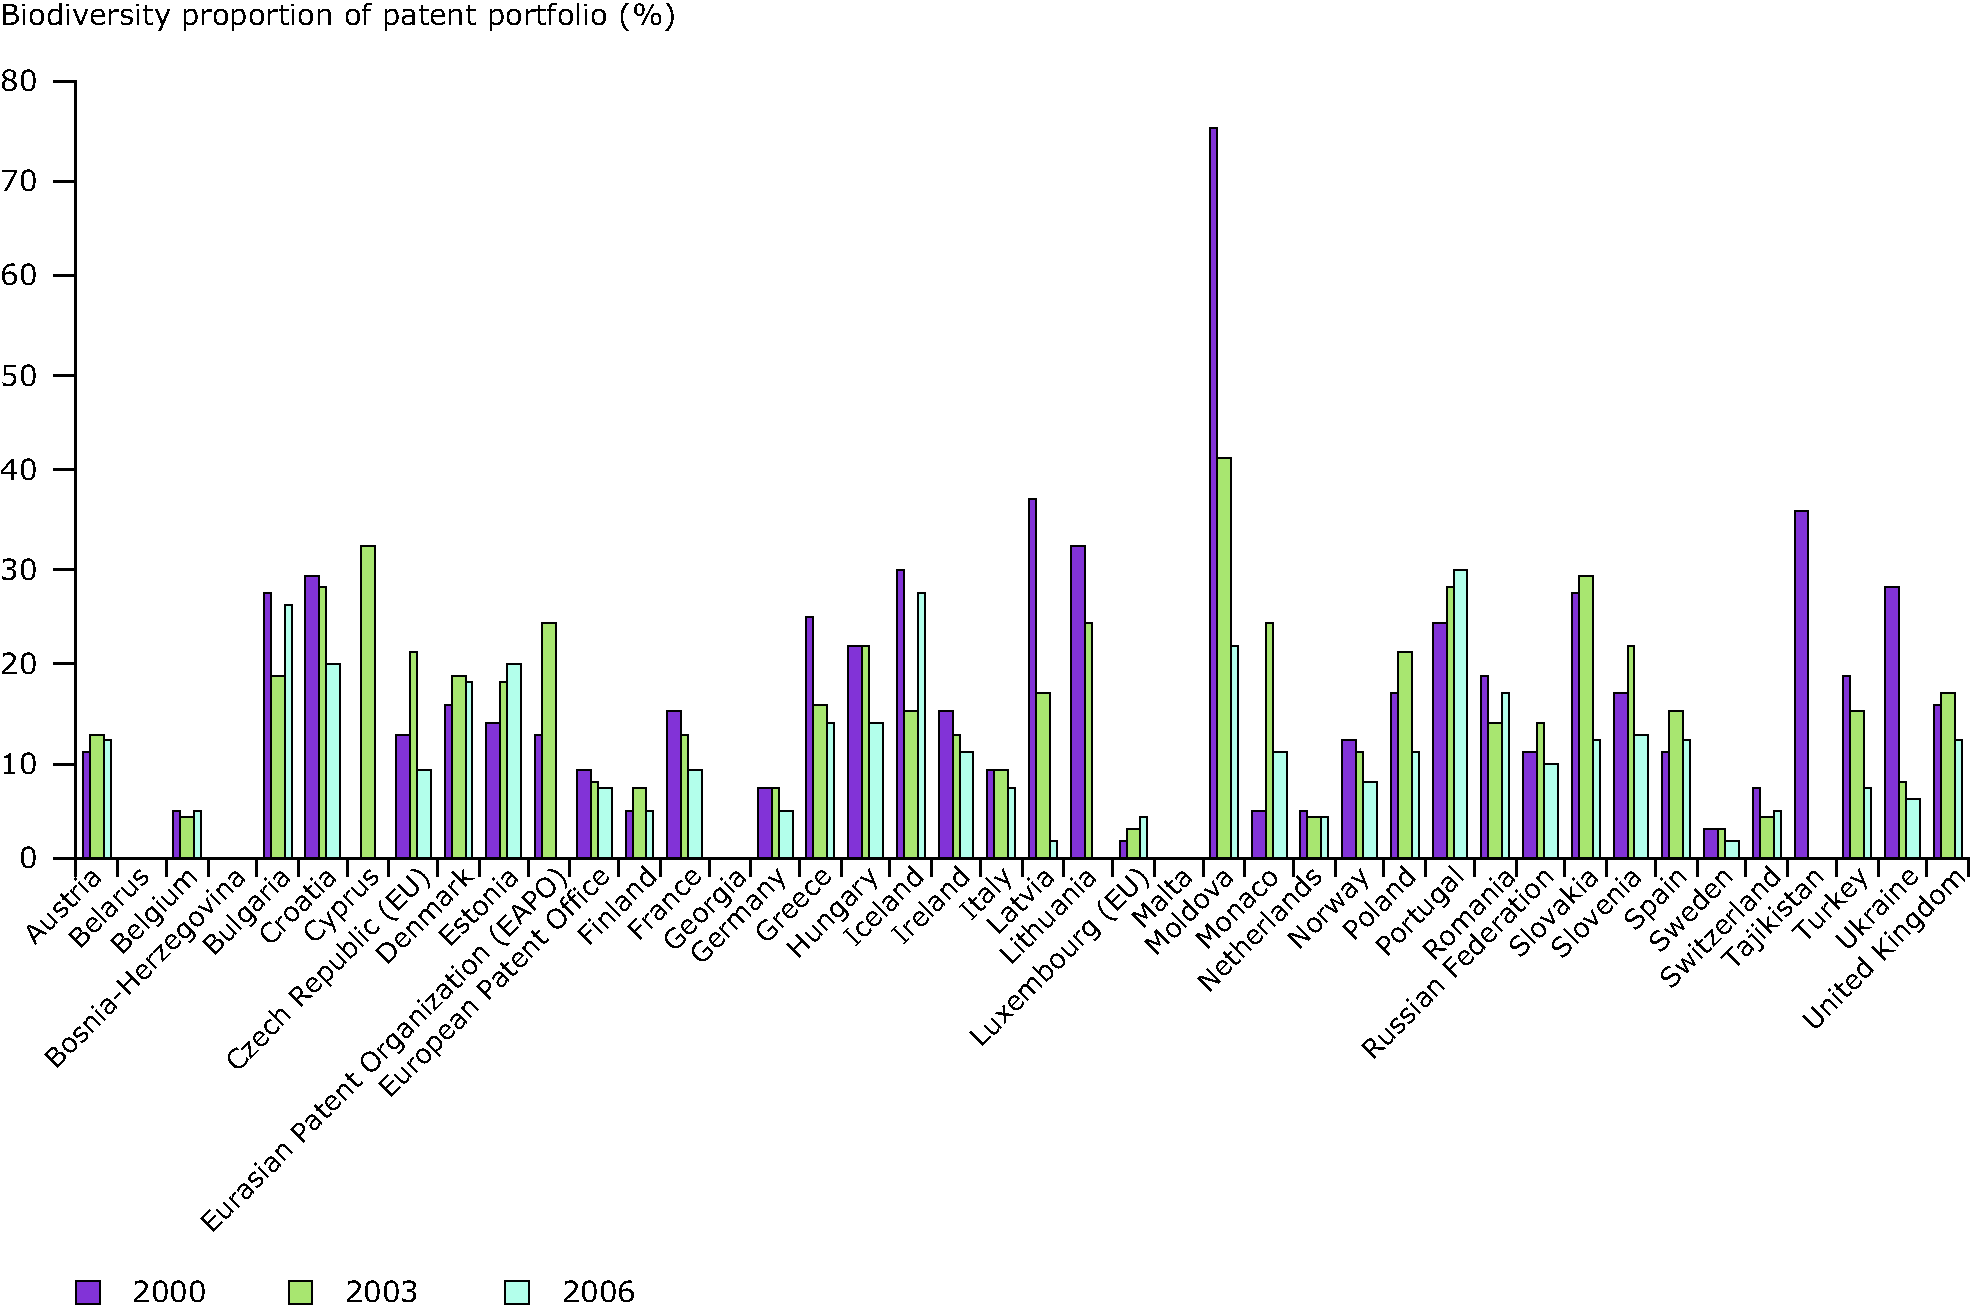
Countries display marked variation in the size of their patent portfolios (e.g. Moldova). When viewed as percentages low levels of activity may display high percentage scores. Conversely, countries with large portfolios may display relatively modest proportions. Patent activity for biodiversity displayed rapid growth in during the 1990s, reaching a total of 591 120 publications before levelling off and then declining. This figure almost doubles to 1 026 227 publications (16 % of the total) if the full spectrum of the pharmaceutical sector is included. This broader measure followed a very similar growth trend to the conservative indicator presented in this summary. European countries are both importers and exporters of intellectual property for biodiversity and the indicator allows these trends to be characterised in more detail. Declining total activity results from declines in biotechnology but disguises underlying activity in areas such as traditional medicines and the emerging field of synthetic biology.


Document Actions
Share with others