Data sources
UWWTD Waterbase serves as a source of data for the UWWTD data viewer. The content of UWWTD Waterbase is based on reporting by Member States to the European Commission related to the Urban Waste Water Treatment Directive (UWWTD) Article 15 and is publicly available for download. Further descriptions and guidelines on this reporting is available from the corresponding section of Reportnet. The structure of the UWWTD Waterbase was derived from the UWWTD data model. The more recent versions of UWWTD Waterbase are included as support for the UWWTD data viewer but also earlier versions are available are directly available from the web-site.
How to view a report
Navigate to a table or a chart in the section "Waste Water Infrastructure - tables and charts".
An empty form like the one below will appear.

Select the “limiting parameters” for the data you wish to view. For example:
- If you wish to view information for all countries click on "select all" in the country drop down list and in the window "Year" select the reference year for which the data was reported (the latest data is available either for 2009 or 2010, historical data is available for 2007 or 2008). Then click "View Report" in the top right corner.
- Similarly if you wish to view waste water treatment plants with capacity above, below or equal to a particular value,
- first enable the capacity window by deselecting the square next to the "Null" label
- then type in the threshold treatment capacity value (in population equivalent, p.e.), in the window ”capacity comparison,” for example "100000".
- Mark “>=“ if you wish to view record above the particular value or mark “<=“ if you are interested in plants below the particular capacity value.
- In the window „Year” select the reference year for which the data was reported (the latest data is available either for 2009 or 2010).
- Then click “View Report” in the top right corner.
- Note that in case no limiting factors (e.g. country or capacity) are selected, the viewer will display all data.
How to export a report
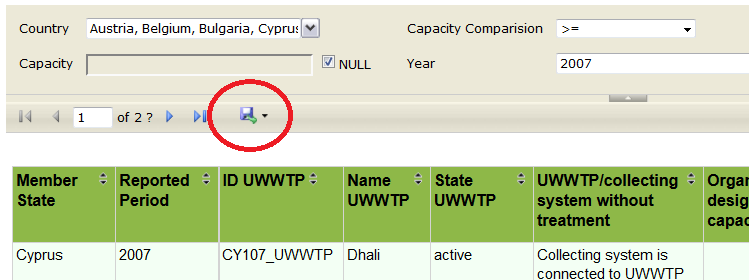
Once you have obtained a report but selecting the desired parameters, you can export it to the .xls format (Excel spreadsheet). This is recommended for a better display of large tables.
To export a report, click on the export button.

What data can be viewed
Agglomerations
Enables user to view the distribution of the total generated load per Member state by agglomeration size category and the treatment type applied.
Enables user to view the waste water pathways in big cities aggregated in particular Member State, or at NUTS level.
This report displays information on the portions of load generated in agglomerations receiving a particular type of waste water treatment. Moreover, it returns the IDs of receiving areas (per type of treatment) and the type of receiving waters (e.g. sensitive area, catchment of sensitive are, normal area). Selection can be made with using filters such as country, NUTs and reference year. Additional filtering can be done e.g. according to the size of agglomeration, date of compliance is possible in the excel sheet exported from the data viewer. As a default (no filters applied), the query returns information on all agglomerations reported.
This report displays information on the portions of load generated in big cities/big dischargers receiving a particular type of waste water treatment. Selection of data can be made with use of filters such as country, big city/big discharger name (and ID) and reference year. Additional filtering e.g. according to the size of big city, date of compliance is possible in the excel sheet exported from the data viewer. As a default (no filters applied), the query returns information on all big cities/big dischargers reported.
Urban waste water treatment plants
This query returns information on all waste water treatment plants and collecting systems, their capacity, type of treatment and information on the UWWTPs performance. UWWTPs´performance, assessed by the Member States, is expressed as effluent concentrations (BOD, COD, TSS, N and P) passing or failing the concentration limits required by the Directive Annex I. Moreover, it returns the ID and type of receiving area and type of receiving water. As a default (no filters applied) the query returns information on all treatment plants/collecting systems reported.
Enables aggregation of information on treatment plants, at the NUTS or MS territory. It returns information on treatment types and compliant/non-compliant monitoring results (as assessed by Member States).
Show receiving water ID/type and total number of treatment plants by type and compliance (according to Member State) selected per country and NUTS, capacity size and year
Receiving areas
This report displays information on receiving areas, i.e. applied article of the UWWTD, date of designation, reasons for designation and sensitivity (N, P). It returns either all receiving areas, or a selection of receiving areas according to one or several parameters mentioned above. Example: Select all Phosphorus - only sensitive areas in Spain, designated after 31.12.2005. Or select all sensitive areas in Italy, for which designation criteria c (i.e. other directives) was applied.
Helpdesk
If you need assistance using the UWWTD data viewer, please contact
extranet-uwwtd-support@roles.eea.eionet.europa.eu

Document Actions
Share with others