9. Stratospheric ozone depletion
| indicator |
policy issue |
DPSIR |
assessment |
| average ozone
column in March |
any improvements already? |
state |
 |
| total potential chlorine and
bromine concentrations in the troposphere |
any improvements already? |
state |
 |
| increase in UV radiation |
public interest
indicator: how serious is the problem? |
state |
 |
| radiative forcing of
ozone-depleting substances |
what is the remaining effect of
ozone-depleting substances on climate change? |
driving force |
 |
| production of ozone-depleting
substances |
are ozone-depleting substances
phased out according to the schedule? is discouraging the use of
HCFCs successful? |
driving force |
 |
| contribution to multilateral fund
to assist developing countries to implement the Montreal
Protocol |
can we ensure that developing
countries meet their targets? |
response |
 |
The thickness of the ozone layer above
Europe has decreased significantly since the beginning of the 1980s
and is declining at a rate of up to 8 % per decade. The gradual
fall in chlorine concentrations in the troposphere (on their way to
the stratosphere) shows that international policies to control
ozone-depleting substances are having success. Production and sales
of ozone-depleting substances in EEA member countries have fallen
significantly since 1989. However, the long life of these
substances in the atmosphere means that recovery of the ozone layer
may not be complete until after 2050. The remaining policy
challenges for European countries are to tighten control measures,
to reduce the production and use of HCFCs and methyl bromide, to
manage banks of existing ozone-depleting substances, and to support
developing countries in their efforts to reduce their use and
subsequent emissions of ozone-depleting substances.
Stratospheric ozone protects the earth’s
surface from damaging short-wave ultraviolet (UV) radiation. Ozone
is produced in the upper stratosphere by short-wave sunlight, which
together with chemical reactions dissociates the ozone again to
create a dynamic balance between production and loss. Anthropogenic
emissions of inert compounds containing chlorine and bromine affect
this balance. A single chlorine or bromine atom can destroy
thousands of ozone molecules before being removed from the
atmosphere.
Compounds causing significant ozone depletion
include chlorofluorocarbons (CFCs), carbon tetrachloride, methyl
chloroform, halons, hydrochlorofluorocarbons (HCFCs),
hydrobromofluorocarbons (HBFCs) and methylbromide. They are used as
solvents, refrigerants, foam blowing agents, degreasing agents and
aerosol propellants, fire extinguishers (halons) and as
agricultural pesticides (methyl bromide). The extent to which an
ozone-depleting substance affects the ozone layer (i.e. its
ozone-depleting potential) depends on the compound’s chemical
characteristics. Other factors that affect the ozone layer include
natural emissions, large volcanic eruptions, climate change and the
greenhouse gases, methane and nitrous oxide.
The dramatic depletion of stratospheric ozone
in polar regions is caused by a combination of anthropogenic
emissions of ozone-depleting substances, stable circulation
patterns, extremely low temperatures and solar radiation. Reactions
on the surface of polar stratospheric cloud particles, which form
at low temperatures, start a series of chemical reactions that
destroy large numbers of ozone molecules in the polar spring, i.e.
March/April in the Arctic and September/October in Antarctica.
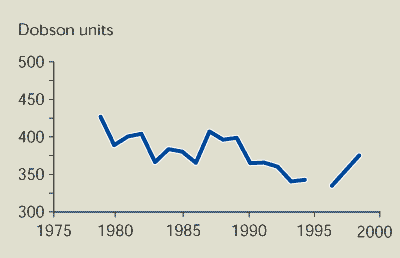
The total amount of ozone over Europe is the
main indicator of the state of the ozone layer above EEA member
countries. The ozone column (a measure of the thickness of the
ozone layer) has decreased significantly since the beginning of the
1980s (Figure 9.1); the observed trend in March is
approximately -8 % per decade. The global trend in the whole
winter/spring period at northern mid-latitudes is -5.4 % per decade
(WMO, 1999).
Figure 9.1:
Average ozone column over Europe in March
Source:
RIVM
Notes:
The ozone column is the amount of ozone in a column that reaches
from the ground to the top of the atmosphere. Monthly average ozone
data derived from satellite instruments (Nimbus 7 TOMS, Meteor3
TOMS and GOME) averaged from 35ºN to 70ºN and from 11.2ºW to
21.2ºE. Different instruments used in different years. 1 Dobson
unit = 0.01 mm ozone column thickness at standard earth surface
temperature and pressure.
 The thickness of the ozone layer over Europe (March averages) has
decreased significantly since the beginning of the 1980s by up to 8
% per decade.
The first international agreement aimed at
protecting the ozone layer was the 1985 Vienna Convention. The
Montreal Protocol of 1987 (and subsequent Amendments and
Adjustments) aims to eliminate the production and use of
ozone-depleting substances worldwide. EU measures and policies to
protect the ozone layer include Council Regulation 3093/94/EC,
which is in the process of being revised and strengthened (European
Commission, 1999a). Current challenges in the EU include:
- ensuring full compliance with the
Protocol by developing countries, as well as in Russia and other
countries with economies in transition;
- reducing remaining production of
ozone-depleting compounds for essential uses and to supply
developing countries;
- stopping the ‘dumping’ of second-hand
equipment CFC-using in developing countries;
- taking action against CFC and halon
smuggling;
- reducing emissions of halons and CFCs
from existing equipment, especially in developed
countries;
- discouraging the use of HCFCs as
replacements for CFCs
- preventing the increased use of methyl
bromide in developing countries;
- preventing the production and marketing
of new ozone-depleting substances.
9.1. Total potential chlorine and bromine
concentrations in the troposphere
The effect of the measures taken is noticed
first in the lower part of the earth’s atmosphere: the troposphere.
The relevant indicator showing this effect is expressed in terms of
‘potential chlorine or bromine concentration’ and is derived from
the concentrations of individual substances (taking into account
the number of halogen atoms in each compound) in the troposphere.
This gives a direct indication of the potential impact of these
compounds on the ozone layer.
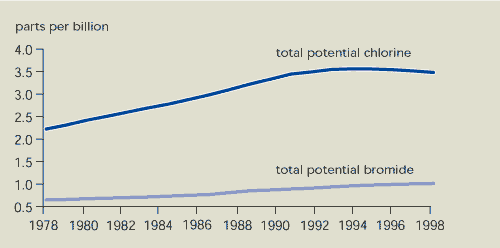
As a result of international policies, the
total potential chlorine concentration in the troposphere
has fallen since 1994 (Figure 9.2). The main reason for this
decline is a large decrease in the concentration of methyl
chloroform. The concentration of some CFCs is decreasing, while the
increase in concentration of other CFCs is levelling off. However,
concentrations of HCFCs (used as an alternative to CFCs) are
increasing.
The concentration of potential chlorine in the
stratosphere is expected to reach its maximum level by
about 2000. Contrary to earlier expectations, the total potential
bromine concentration is still rising due to increased
concentrations of halons.
Figure 9.2:
Total potential chlorine and bromine concentrations in the
troposphere
Source:
RIVM; ALE/GAGE/AGAGE network; NOAAA/CMDL network
Notes:
Total potential chlorine/bromine is defined as the sum of the
concentrations of all chlorine/bromine species in the troposphere,
multiplied by the number of chlorine/bromine atoms per molecule.
The sum of the bromine compounds is multiplied by the bromine
efficiency factor of 60 for total potential bromine to account for
the different ozone-depleting efficiency of bromine.
 Although total potential chlorine concentrations in the
troposphere reached their maximum around 1994, total potential
bromine concentrations in the troposphere are still
increasing.
Because ozone-depleting substances have a very
long lifetime in the stratosphere, detectable recovery of the ozone
layer due to the Montreal Protocol is not expected before 2020.
Complete recovery is not expected to occur until after 2050 (WMO,
1999). Over the polar regions, extensive ozone depletion will
continue to be observed in spring in the coming decades.
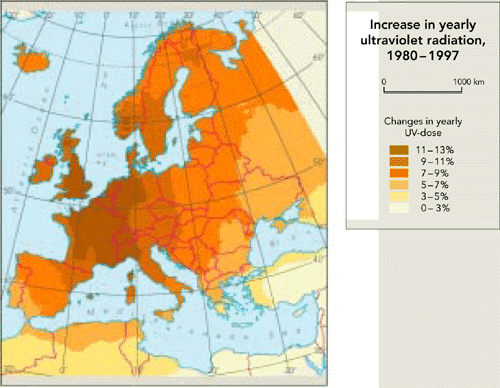
Ground-based measuring stations have recorded
increases in the amount of UV radiation in recent years. Modelled
estimates (Figure 9.3) show the percentage increase in UV radiation
at wavelengths that cause human skin to turn red. These
satellite-derived UV data and ground measurements generally
agree.
Increased levels of UV radiation will continue
until ozone recovery is complete, but the damaging effects of UV on
human health and ecosystems are likely to persist even longer. Skin
cancers, for example, only appear many years after exposure to UV.
However, the general increase in cases of skin cancer in Europe
over the past 50 years is most likely due to changes in
lifestyle leading to more exposure to the sun. The anticipated
effect of an increase in UV radiation will be superimposed on this
effect. Public health campaigns encouraging people to reduce their
exposure to the sun may offset the adverse effects of ozone
depletion (United Kingdom Stratospheric Ozone Review Group,
1999).
Figure 9.3:
Increase in UV radiation in Europe, 1980-1997
Source: EEA,
1999; RIVM
Note: The
map shows the increase in the yearly dose of UV radiation during
the 17 year period, calculated using observed total ozone values
from TOMS satellite instruments and assuming clear sky
conditions.
 Observations suggest that UV radiation has increased
above Europe.
9.2. The interaction between climate change and
ozone depletion
Some ozone-depleting substances, e.g. CFCs and
HCFCs, are also potent greenhouse gases. Stratospheric ozone
depletion and climate change (see Chapter 8) therefore have
common sources. Ozone is also a greenhouse gas, but most of the
warming effect comes from troposheric ozone.
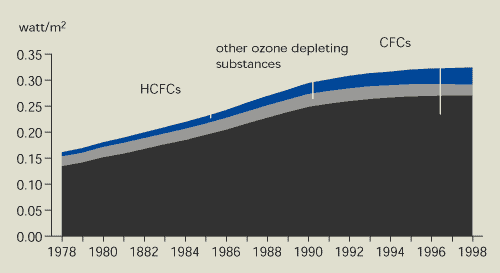
CFCs, HCFCs and related compounds contribute
about 13 % to the total radiative forcing (the net extra radiation
giving rise to global warming) from all greenhouse gases (Figure
9.4).However, their emissions are not regulated under the Kyoto
Protocol (see Sections 8.2 and 8.3) because they are already
controlled under the Montreal Protocol. HFCs, which are
increasingly used as substitutes for ozone-depleting substances,
are also potent greenhouse gases. HFCs are covered by the Kyoto
Protocol rather than the earlier Montreal Protocol.
The radiative forcing of ozone-depleting
substances is still increasing, but less than in the 1980s. There
are a number of reasons for this. The phasing-out of methyl
chloroform under the Montreal Protocol is largely responsible for
the decrease in total potential chlorine. However, methyl
chloroform contributes less to radiative forcing than CFCs and
HCFCs. In addition, the contribution from CFCs is levelling off as
a direct result of the Montreal Protocol and the radiative forcing
of HCFCs is increasing as their concentration in the troposphere
increases.
Figure 9.4:
Radiative forcing of ozone-depleting substances at a global
level
Source:
RIVM
Note:
Radiative forcing is based on global average tropospheric
concentrations (Figure 9.2) and WMO radiative forcing
parameters.
 The radiative forcing of ozone-depleting substances is
still increasing. This is because the radiative forcing of HCFCs is
increasing, while that of CFCs is levelling off.
9.3 European production of ozone-depleting
substances
The production of CFCs, carbon tetrachloride,
methyl chloroform and halons in Europe fell substantially between
1989 and 1997, while production of HCFCs increased
(Figures 9.5 and 9.6). The sale of ozone-depleting substances
shows a similar pattern. This overall decline in the production and
sale of ozone-depleting substances in EEA member countries is a
direct result of the Montreal Protocol and EU regulations. Halon
production in the EU has been banned since 1994 and production of
CFCs, carbon tetrachloride and methyl chloroform since 1995.
Limited production and use of certain compounds (mainly CFCs) is
still allowed for designated essential uses (e.g. metered dose
inhalers for medical purposes) and for use to meet the basic needs
of developing countries. Production for sale to developing
countries accounts for the increase in 1997. HCFCs and methyl
bromide may still be produced and sold in the EU subject to
mandatory limits.
The production of ozone-depleting substances in
EEA member countries was about 32 % of global production in 1989
and about 25 % in 1996. In all member countries, use of
ozone-depleting substances has fallen faster than required under
the Montreal Protocol.
Global production and emissions of
ozone-depleting substances have also decreased significantly.
However, existing equipment and products still contain large
amounts of CFC and halons –generating emissions when these are
released. Emissions of ozone-depleting substances can occur within
a few months of production (e.g. during the manufacture of open
cell foams) or after several years (e.g. from refrigerators,
closed-cell foams and fire extinguishers).
Smuggling and illegal production of
ozone-depleting substances is estimated at 10 % of 1995 global
production. These illegal activities will delay the recovery of the
ozone layer by several years.
Figure 9.5:
Production of ozone-depleting substances in EEA member
countries
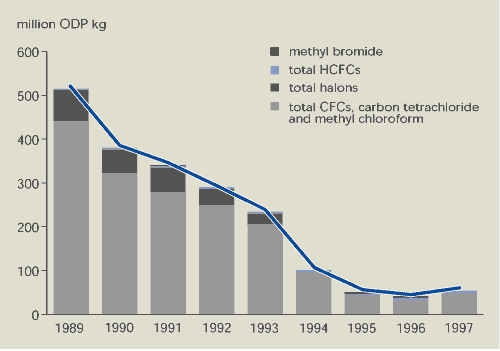
Source:
European Commission 1999b; UNEP, 1998
Notes:
Production is defined as actual manufacture in the EU for
dispersive uses, but excluding: imports; production for use as a
raw material for the production of other chemicals; and used
material recovered, recycled or reclaimed. Production data is
weighted according to ozone-depleting potential (ODP).
Figure 9.6:
Production of HCFCs in EEA member countries
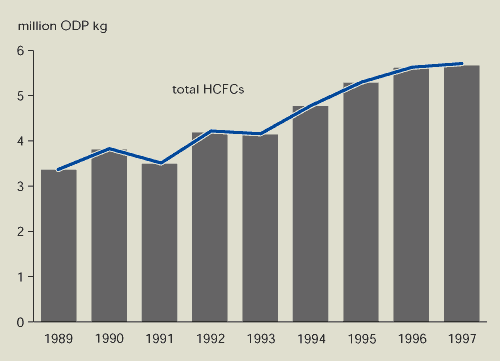
Source:
European Commission, 1999b; UNEP, 1998
 Production of ozone-depleting substances in EEA member
countries has decreased by almost 90 %. However, production of
HCFCs — with low ozone-depleting potential but high global warming
potential — is increasing.
9.4 Technology transfer to developing
countries
Europe’s successes and the recovery of the
ozone layer will be jeopardised unless developing countries also
meet their commitments under the Montreal Protocol. These came into
effect in 1999.
In 1990, a multilateral fund was established by
the Parties to the Montreal Protocol to help developing countries
implement the Protocol. Developed countries contribute to this
fund, while developing countries can apply for financial assistance
for particular projects.
EEA member countries contributed US $371.6
million to the multilateral fund between 1991 and 1998. This amount
is about 45 % of total global payments to the fund (Figure 9.7).
The total amount spent so far by the fund (US $936 million) is
expected to result in the phasing out of the use of 122 million ODP
kg (more than twice the 1997 production in EEA member countries)
and the phasing-out of the production of about 42 million ODP kg of
ozone-depleting substances.
Figure 9.7:
Relative contribution of EEA member countries to multilateral fund
to assist developing countries implement the Montreal Protocol,
1991-1998
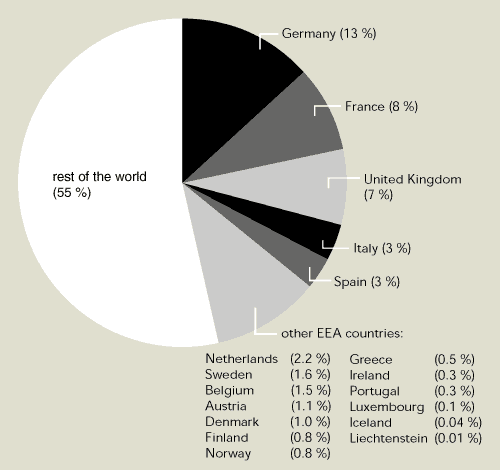
Source:
UNEP, 1999
 EEA member countries have together contributed around 45
% of the total multilateral fund to help developing countries
reduce their emissions of ozone-depleting substances.
| Methyl bromide: supporting developing
countries |
|
Twelve years after being signed, the Montreal
Protocol is viewed as a success. Methyl bromide, which has an
ozone-depleting potential of 0.6 compared to CFCs, was added to the
list of controlled substances in 1992. The Copenhagen Amendment
requires the phasing out of methyl bromide in developed countries
by 2005 and in developing countries by 2015.
Methyl bromide is still used throughout the
developing world as a fumigant to control pests in soils,
structures and commodities. However, alternatives for 90 % of
methyl bromide applications have been found . often as part of
integrated pest management, but few have yet been implemented.
GTZ, the German Agency for Technical
Co-operation, is advising developing countries on possible
substitutes for methyl bromide. GTZ emphasises non-chemical
alternatives such as crop rotation and biocontrol. GTZ is also
helping with the disposal of old stocks of methyl bromide; for
example, it recently helped the Sudanese government dispose of over
eight tonnes of methyl bromide.
Source:
UNEP
|
9.5 Indicator improvement
Harmonisation of data reportingon current
production and sale of ozone-depleting substances to both the
European Commission and the United Nations Environment Programme
(UNEP) would remove some inconsistencies from the indicators.Data
on individual EU Member States is not available.
For the future, improved breakdowns for
contributions by European countries to the multi-lateral fund to
help developing countries implement the Montreal Protocol would be
desirable.Analysis of the effectiveness of this policy instrument
in helping to reduce the production and consumption of
ozone-depleting substances in developing countries would also be
useful.
For the future, improved indicators and
analysis of the interactions between climate change and ozone
depletion should be developed. Radiative forcing, which is
presented here, is just one example of such an indicator. Another
interesting interaction is the temperature fall in the stratosphere
due to greenhouse gas emissions and its effect on the ozone layer
at mid-latitudes and polar regions. However, this interaction is
more difficult to assess.
9.6. References and further reading
EEA (1999). Environment in the European
Union at the turn of the century. European Environment Agency,
Copenhagen.
European Commission, DG Research (1997).
European research in the stratosphere.
EUR 169986 EN. European Commission, Brussels.
European Commission (1999a). ‘A Common Position
for a revised Council Regulation on substances that deplete the
ozone layer 5748/99.’ Official Journal C123/03.
European Commission (1999b). Statistical
factsheet — ozone-depleting substances. European Commission,
Brussels.
WMO (1999). Scientific assessment of ozone
depletion: 1998. World Meteorological Organisation Global
Ozone Research and Monitoring Project — Report 44. World
Meteorological Organisation, Geneva.
UNEP (1998). Production and consumption of
ozone-depleting substances 1986-1996. United Nations
Environment Programme, Nairobi, Kenya.
UNEP (1999), UNEP/OzL.Pro/ExCom/27/48 (Annex I,
Page 5). United Nations Environment Programme, Nairobi, Kenya (http://www.unmfs.org).
United Kingdom Stratospheric Ozone Review Group
(1999). Stratospheric ozone 1999. Department of the
Environment, Transport and the Regions, London, UK.


Document Actions
Share with others