Clean and great data is the most important factor for generating great visualizations.
Data comes in many formats and quite often it already contains some presentation and layout formatting which is not understandable by another software. Therefore, in order to better analyse the data and create interactive visualisations we need to get the data as clean and raw as possible so that any other software can process the data.
Here we list generic guidelines and tips on how to make a clean raw data table. Following these tips will help you create great visualisations with EEA's data visualisation tool called Daviz.
The tips are generic and therefore may be as well followed to create clean raw data for any other visualisation software.
1. Identify your data table
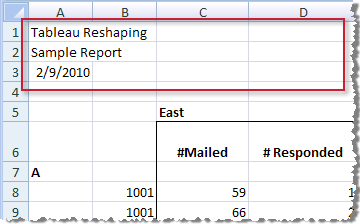
Sometimes excels sheets contains multiple data tables within the same sheets. This is not semantically correct, each sheet must have one data table. Do not upload files/copy and paste data with multiple data tables. Identify and isolate your data table you want to visualize.
2. The first row of the table should be "headers"
The first row of the table should start with the "headers" that describe the columns. Remove or exclude introductory and other unnecessary text.
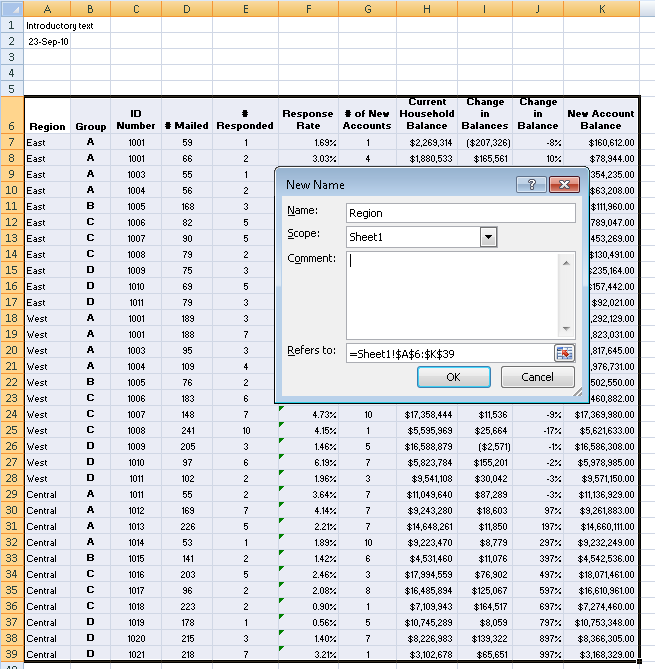
You may also create a separate sheet with just the raw data table. If you are using the “copy and paste data input” you may just copy and paste the data table part as shown below.
Make headers understandable, human readable and with units in parenthesis.
If you have to use acronyms in headings, make sure they are explained in the context where the visualisation is displayed/embedded.
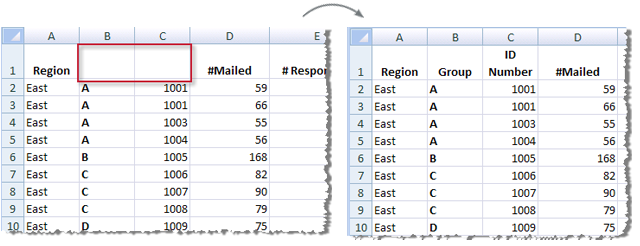
3. Add missing headers
4. Remove multiple headers and merge them into one
5. Columns data types and detection
Daviz automatically recognise certain data types.
Numbers. Punctuation matters. Use dot “.” as the decimal delimeter for example 1200.25.
If you need to indicate numbers are percentages or currency, put that information in the column headers, not beside the number.
wrong
| Country |
GDP per capita |
| France |
$35,048 |
| Italy |
$30,16 |
correct
|
Country
|
GDP per capita (USD, 2010) |
| France |
35048 |
| Italy |
30165 |
Enforce data type
You can avoid the daviz type guessing and specify manually what types the column are. This makes sure your data is not wrongly interpreted by daviz.
Enforcing is done by adding the type in the header as following example
| Name | Birth:date | Favorite beach:latlong | Age:number | Homepage:url |
|---|
| Don Giovanni |
1999-02-02 |
12.3454,-122.16456 |
21 |
http://example.com |
If not type is assigned to a header, daviz will try to guess.
These are the types you can use:
| Data Type | Value examples | notes |
|---|
|
boolean
|
true or false |
|
| date |
2010-03-02 |
see ISO 8601 format
|
| latitude |
37.423573
|
WGS84 coordinate system |
| longitude |
-122.161867
|
WGS84 coordinate system |
| latlong |
37.423573,-122.161867 |
WGS84 coordinate system |
| list |
['one item','second item'] |
|
| number |
23.05 |
integer or floats |
| text |
any text you like |
|
| url |
http://www.eea.europa.eu |
|
6. Clean any annotations in the columns values
Numbers should be just numbers. Date must be just dates etc. If you you need to annotate a value, add it in clear text in the description (or additional information) field of your visualization, for example “GDP value for Spain year 2010 does not include Madrid”.
7. Blank cells and annotations
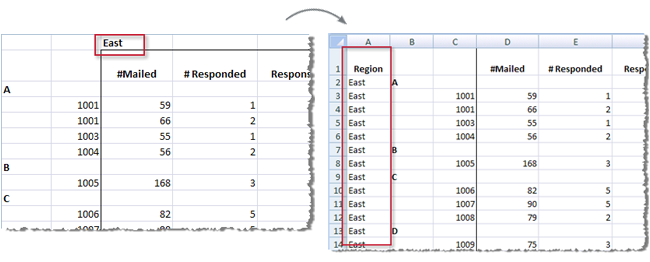
Sometimes the data contains blank cells just for layout reasons, they actually have the value of the parent category cell. In this case fill the value with the parent cell value.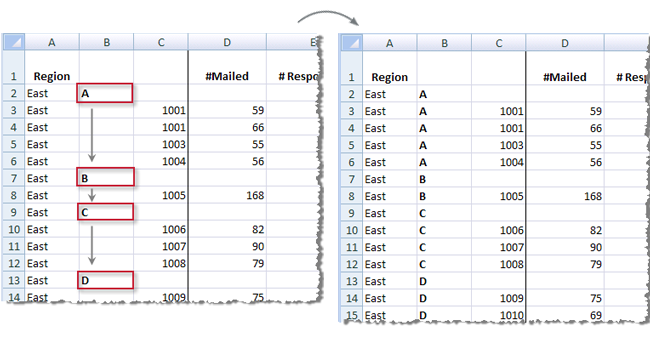
In other cases it is legitimate to have blank cells, they denote an "unknown / not reported" value. In this case leave them blank. And put any annotation like "n.a." or "Not reported" in a consequent column labeled accordingly e.g. "Annotations". All the cells must have values, see example.
Data table example with annotations
| Country | CO2 (tonnes) | CO2 annotations | Costs (million euros) | Costs annotations |
|---|
| Sweden |
34 |
|
45 |
|
| Italy |
|
Not reported |
|
Not available |
| Spain |
123 |
Does not include energy sector |
395 |
Does not include energy sector |
| Germany |
563 |
|
1745 |
|
8. All rows must have same amount of columns, matching the columns headers
Simply check your data before using it with Daviz so that it does not contains rows with more columns than the actual column headers.
9. Clean up summaries (total, averages, etc) and descriptive rows
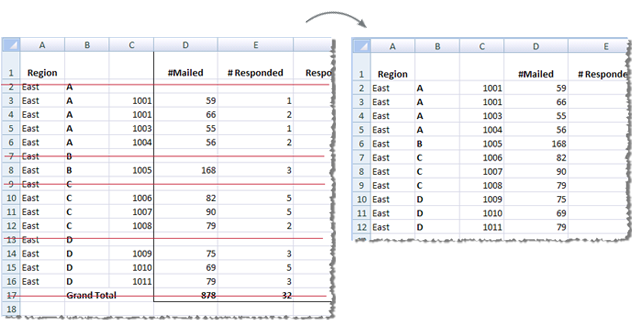
Many data table contains summaries rows, like the total or average for some columns. Sometimes you also find descriptive / headers row, just for layout reasons. These rows will most probably break your visualization. Therefore, If you don't want a summary row to show up as a separate item in your visualization, delete it before uploading or filter the row out directly in Daviz.
10. Adjust data layout (rows vs columns)
Each visualization has its own data layout. The EEA Data visualization tool (Daviz) helps adjusting the table formats via the online data table manipulation to fit the visualization requirements. So in most cases you can change rows into column (Pivot) via the Daviz table editor while creating a chart.
The opposite operation is called transpose, which makes columns into rows. This operation is better/easier done via a simple Excel transpose operation before uploading. For example, in Microsoft Excel, copy your data table, make a new worksheet, then choose Edit, go to Paste-Special, and then go to Transpose.
11. How to create TSV/CSV
If you want to use the upload data file option, the file must be in TSV / CSV format. This is done in Excel or OpenOffice/LibreOffice via File > Save as > then choose the CSV file format, use “Tab” or “,” as field separator, double quotes " for the text delimiter and finally make sure text is unicode UTF-8. See CSV Example file and TSV Example file.
12. For developers: data from a URL in JSON format
You can use data from an external URL. The URL must return JSON format. Any of the following JSON formats are supported by DaViz:
NOTE: Make sure the JSON is returned in UTF-8 and does not contain the BOM.

Document Actions
Share with others