8. Climate change
| indicator |
policy issue |
DPSIR |
assessment |
| emission of
greenhouse gases |
are the Kyoto Protocol targets
within reach? |
pressure |
 |
| carbon dioxide emissions |
how are the emissions of each of
the gases developing, and which sectors contribute? |
pressure |
|
| methane emissions |
- " - |
pressure |
 |
| nitrous oxide emissions |
- " - |
pressure |
|
| fluorocarbon emissions |
- " - |
pressure |
 |
| global and European average
temperatures |
is the development of average
temperature staying below provisional 'sustainable targets'? |
impact |
|
Climate change is widely recognised as a
serious potential threat to the world’s environment. The problem is
being addressed through the United Nations Framework Convention on
Climate Change (UNFCCC) and has been identified by the EU as one of
the key environmental themes to be tackled. However, total
greenhouse gas emissions have increased since 1990 in most EEA
member countries and are projected to increase in the EU, under a
baseline scenario, by 6 % between 1990 and 2010. Additional
policies and measures are required to achieve the Kyoto Protocol
targets. Substantial additional reductions in global emission
reductions will be needed to reach potentially ‘sustainable’
temperature levels and concentrations of greenhouse gases in the
atmosphere.
The greenhouse effect is a natural phenomenon.
However, over the past century atmospheric concentrations of
anthropogenic greenhouse gases — carbon dioxide
(CO2, methane, nitrous oxide and
halogenated compounds such as chlorofluorocarbons (CFCs),
hydrofluorocarbons (HFCs), perfluorocarbons (PFCs) and sulphur
hexafluoride — have risen, and a considerable increase, in historic
terms,in global mean temperatures has been observed. There is
increasing evidence that greenhouse gas emissions from human
activities are causing an enhanced greenhouse effect. This takes
the form of global warming, leading to climate change (IPCC, 1996).
Climate change is expected to have widespread consequences,
including: sea-level rise and possible flooding of low-lying areas;
melting of glaciers and sea ice; changes in rainfall patterns with
implications for floods and droughts; and more climatic extremes
(especially high temperatures). These effects will have major
impacts on ecosystems, health, water resources and key economic
sectors such as agriculture.
Globally, carbon dioxide is estimated to have
made the biggest contribution to global warming (64 %), followed by
methane (20 %), nitrous oxide (6 %) and halogenated compounds (10
%) (IPCC, 1996). Tropospheric ozone (see Chapter 10) also adds to
global warming. Aerosols can have a cooling effect, partly
offsetting global warming, but this effect is regional and
short-lived. As well as contributing to global warming, CFCs are
also ozone-depleting substances (see Chapter 9).
The EU Kyoto Protocol target for 2008-2012
requires a reduction of emissions of six greenhouse gases by 8 %
from 1990 levels. Total EU emissions of the three main greenhouse
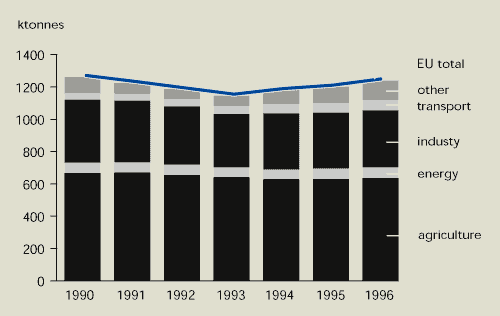
gases have fallen by 1 % from 1990 to 1996 (Figure 8.1). Carbon
dioxide makes the largest contribution to EU emissions (79 %),
followed by methane (11 %) and nitrous oxide (9 %). The Kyoto
Protocol target also includes HFCs, PFCs and sulphur hexafluoride;
emissions of these substances are not shown in Figure 8.1 owing to
lack of data from all EU Member States. Initial estimates indicate
that these gases together amount to about 1 % of total EU
greenhouse gas emissions.
Figure 8.1:
Total EU emissions of carbon dioxide, methane and nitrous
oxide
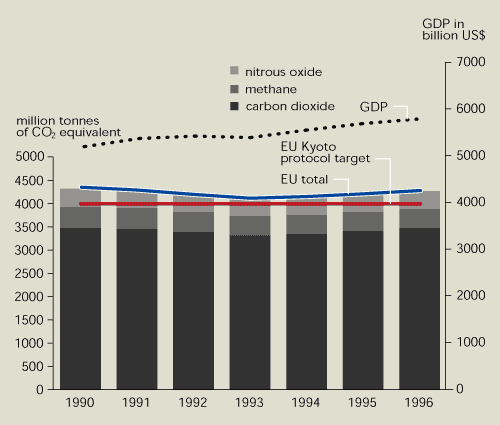
Source: EEA
Note:
Global warming potentials used: carbon dioxide 1, methane 21, and
nitrous oxide 310.
Total EU greenhouse gas emissions have fallen slightly from
1990 (but only in a few Member States), while GDP has risen.
However, emissions are projected to increase by 6 % between 1990
and 2010, making additional policies and measures necessary to
achieve the Kyoto Protocol target.
The dominant human activity or driving force
for climate change is fossil-fuel combustion (due to its carbon
dioxide emissions). Other activities that contribute to greenhouse
gas emissions are agriculture, land-use changes (including
deforestation), waste disposal to landfills and industrial
processes such as cement production, refrigeration, foam blowing
and solvent use.
Gases and particles emitted from aircraft
directly to the upper troposphere and lower stratosphere also
contribute to climate change. In 1992, carbon dioxide emissions
from aircraft produced 2 % of total anthropogenic carbon dioxide
emissions (accounting for around 13 % of all global carbon dioxide
emissions from transport). Global aviation has grown rapidly over
the past 30 years. This trend is expected to continue with
passenger air travel increasing by 5 % per year and total aviation
fuel use (including passenger, freight and military) by 3 % per
year between 1990 and 2015 (IPCC, 1999). Under the IPCC baseline
scenario, carbon dioxide emissions from global aviation are
expected to grow by a factor of about three by 2050. The
contribution of aircraft to global warming is expected to increase
from 3.5 % in 1992 to 5 % by 2050.
8.1. Greenhouse gas policy update
The United Nations Framework Convention on
Climate Change (UNFCCC) was adopted at the 1992 UN Conference on
Environment and Development in Rio de Janeiro when developed
countries made a commitment to aim to return their emissions of
greenhouse gases not controlled by the Montreal Protocol to 1990
levels by 2000. By September 1999, 180 countries or groups of
countries had ratified the Convention, including the EU, all 15
Member States and most other European countries.
At the Third Conference of the Parties of
UNFCCC held in Kyoto in December 1997, developed countries agreed
to reduce their emissions of carbon dioxide, methane, nitrous
oxide, HFCs, PFCs and sulphur hexafluoride by an overall 5 % from
1990 levels by 2008-2012 (expressed in carbon dioxide equivalents
using global warming potentials with a 100-year time horizon). The
amount each country is allowed to emit between 2008 and 2012 is
determined by its carbon dioxide equivalent emissions of the six
greenhouse gases in the base year 1990 (the base year is 1990 or
1995 for HFCs, PFCs and sulphur hexafluoride). Each Party is
required to make demonstrable progress in achieving its commitments
by 2005.
According to the Kyoto Protocol, net changes in
carbon stocks due to changes in forest area since 1990 (so-called
‘Kyoto forests’) and some other carbon sinks can be used to meet
reduction targets. However, the Parties still have to agree
relevant definitions and accounting rules, particularly for other
types of carbon sinks such as soil.
By September 1999, 84 Parties to the UNFCCC –
including the EU and the US – had signed the Kyoto Protocol.
However, only 16 Parties have ratified it and, as yet, no major
developed country has ratified. The Protocol has therefore not yet
entered into force. To become binding international law, it has to
be ratified by 55 Parties and the developed countries that have
ratified must account for at least 55 % of total carbon dioxide
emissions from developed countries in 1990.
The EU and its Member States are committed to
reducing emissions by 8 % below the 1990 level and the central and
eastern European (CEE) countries to reductions of 0-8 %. In June
1998, a system of ‘burden sharing’ or ‘target sharing’ was agreed
by EU Member States (European Commission, 1998). Table 8.1
summarises the requirements of this agreement.
An emission level of about 3 840 million tonnes
of carbon dioxide equivalents is required by 2008-2012 to meet the
EU target (see Table 8.1). To reach this target, a reduction
of almost 600 million tonnes is required from the estimated
projected emissions for 2010 under a baseline scenario of
4 420 million tonnes of carbon dioxide equivalents (see
Section 8.2.1).
| Table 8.1: Total
emissions of carbon dioxide, methane and nitrous oxide from EU
Member States and the EU ‘burden-sharing’ agreement |
| |
Emissions 1990 (million tonnes
CO2 equivalent) |
Emissions 1996 (million tonnes
CO2 equivalent) |
% change 1990-1996 |
Burden sharing
2008-2012 (% from 1990) |
Burden sharing annual emissions
2008-2012 (million tonnes CO2 equivalent) |
| Austria |
74 |
76 |
3 |
-13 |
64 |
| Belgium |
137 |
153 |
12 |
-7.5 |
127 |
| Denmark |
70 |
90 |
29 |
-21 |
55 |
| Finland |
70 |
78 |
11 |
0 |
70 |
| France |
546 |
550 |
0 |
0 |
546 |
| Germany |
1 201 |
1 063 |
-11 |
-21 |
949 |
| Greece |
104 |
111 |
7 |
25 |
130 |
| Ireland |
57 |
60 |
5 |
13 |
64 |
| Italy |
521 |
552 |
6 |
-6.5 |
487 |
| Luxembourg |
14 |
8 |
-43 |
-28 |
10 |
| Netherlands |
209 |
233 |
12 |
-6 |
196 |
| Portugal |
68 |
77 |
13 |
27 |
87 |
| Spain |
301 |
311 |
3 |
15 |
347 |
| Sweden |
69 |
77 |
11 |
4 |
72 |
| UK |
726 |
684 |
-6 |
-12.5 |
636 |
| EU total |
4 167 |
4 123 |
- 1 |
-8 |
3 840 |
| Source: UNFCC, 1998; UNFCCC, 1999a; EEA, 1999b |
Note: HFCs,
PFCs and sulphur hexafluoride are excluded due to lack of data. The
values for Denmark are not adjusted for imports/exports of
electricity for Denmark. The burden-sharing target for Denmark
applies to adjusted emission estimates (base year and commitment
years) and, if taken into account, will give the following
estimates for Denmark: 76 million tonnes for both 1990 and 1996.
Emissions and removals due to land-use change and forestry (LUCF)
are excluded both from this table and elsewhere in the chapter
because of major uncertainty in their estimates.
The Kyoto Protocol introduced three important
new ‘flexibility mechanisms’ (the so-called Kyoto Mechanisms) to
help reach the targets. These mechanisms include emissions trading
between developed countries, joint implementation among developed
countries, and co-operation between developed and developing
countries in a ‘clean-development mechanism’.
Emissions trading allows Parties that reduce
their greenhouse gas emissions below their assigned amount to sell
part of their emission allowance to other Parties. However, some
countries, e.g. Russia, could have large quantities of unused
assigned amounts of emissions available for trading. This issue is
often referred to as trading in ‘hot air’, since it could imply
that no real reduction in emissions would occur. The extent of this
problem is uncertain as it depends on the economic development of
countries like Russia. Some Member States have announced plans to
use the Kyoto Mechanisms to reach their commitments. For example,
the Netherlands has indicated it expects to fulfil 50 % of its
required emission reductions in this way. To ensure that domestic
measures are also taken to limit emissions, the EU Council has
proposed a numerical limit on the use of Kyoto mechanisms (European
Commission, 1999a).
The Buenos Aires Action Plan adopted at the
fourth Conference of Parties in November 1998 (UNFCCC, 1999b)
includes work to be finalised in 2000 on: elaborating the
practicalities of the Kyoto Mechanisms; technology transfer to
developing countries; and financial mechanisms to help developing
countries combat the adverse effects of climate change (e.g.
through adaptation measures). Work has progressed slowly since then
owing to the many complications. These were discussed at the fifth
Conference of Parties in Bonn in November 1999, which set the
ambitious goal of finalising much of the work plan at the next
conference in the Netherlands in November 2000.
8.2. Current and future trends in
greenhouse gas emissions in EEA member countries
8.2.1. Total greenhouse gases
Total EU emissions of the three main greenhouse
gases (carbon dioxide, methane and nitrous oxide) fell by 1 %
between 1990 to 1996, while GDP increased substantially (see
Figure 8.1, Figure 8.2 and Table 8.1). This suggests
that there has been some de-coupling between emissions and economic
growth. The reasons for the small decrease are described below for
the individual gases concerned. Greenhouse gas emissions from EU
Member States made up 25 % of total emissions from developed
countries in 1990 (EEA, 1999b; UNFCCC, 1998; UNFCCC, 1999a).
Figure 8.2 shows the percentage change in total
emissions of carbon dioxide, methane and nitrous oxide (weighted
according to global warming potential) compared with individual
country targets to meet the Kyoto Protocol. Between 1990 and 1996,
total greenhouse gas emissions fell in only three EEA member
countries (Germany, Luxembourg and the UK).
Figure 8.2:
Percentage change in total emissions of carbon dioxide, methane and
nitrous oxide in EEA member countries since 1990 and their Kyoto
Protocol targets
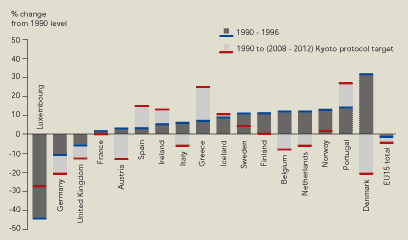
Source: EEA
Notes:
Global-warming potentials used: carbon dioxide 1, methane 21, and
nitrous oxide 310.
In Iceland, Norway and most EU Member States, greenhouse gas
emissions have increased since 1990. To achieve the Kyoto Protocol
targets, substantial reductions in emissions of all six greenhouse
gases are required in most EEA member countries.
Total EU emissions of carbon dioxide, methane
and nitrous oxide in 2010 are projected, under a baseline scenario,
to be about 6 % higher than 1990 levels at about 4 420 million
tonnes of carbon dioxide equivalents (EEA, 1999a). This baseline
scenario assumes future developments of the main socio-economic
parameters (such as GDP) and energy use according to a pre-Kyoto
‘business-as-usual’ scenario prepared by the European Commission.
The scenario also assumes the implementation of policies and
measures agreed by August 1997.
The 8 % reduction in EU emissions demanded by
the Kyoto Protocol target equates to total emissions of the three
main greenhouse gases by 2008-2012 of about 3 840 million
tonnes of carbon dioxide equivalents (see Table 8.1). This requires
a decrease of almost 600 million tonnes from the projected baseline
scenario emissions for 2010 (EEA, 1999a). More policies and
measures therefore need to be implemented in the EU to achieve the
Kyoto Protocol target than were in place in 1997.
8.2.2. Carbon dioxide
Carbon dioxide emissions from EU Member States
decreased initially in the early 1990s, but started to increase
again in 1994 (Figure 8.3). The energy sector (mainly power
and heat generation) is the main contributor to EU emissions (32
%), followed by transport (22 %) and industry (21 %). Emissions in
1996 were at almost the same level as 1990 due to decreases in
Germany, Luxembourg and the UK. Emissions have increased
significantly in all other Member States. Between 1990 and 1996,
the largest emission reduction took place in Germany, mainly due to
economic restructuring in former East Germany and increased energy
efficiency. The substantial UK reduction in emissions was primarily
caused by a switch from coal to natural gas (natural gas produces
lower emissions per unit of energy used). Emission trends in EEA
member countries are shown in Table 8.2.
Carbon dioxide emission trends can be compared
with economic development during the same period. Between 1990 and
1996, GDP in the EU grew by about 9 % (almost 6 % between 1990 and
1995). Apart from the oil crisis in the early 1980s, the five-year
average GDP growth in the period 1960 to 1990 was about 16 %. This
suggests that the reduction in carbon dioxide emissions between
1990 and 1996 is partly due to the relatively low GDP growth in
this period, partly to an increase in energy efficiency, and partly
to the effects of policies and measures to reduce greenhouse gas
emissions.
In the fifth environmental action programme
(5EAP), the EU set a target of stabilising carbon dioxide emissions
at 1990 levels by 2000. EU carbon dioxide emissions in 2000 are
predicted to be ± 2 % the 1990 level (EEA, 1999a and 1999b).
Figure 8.3:
Total EU carbon dioxide emissions
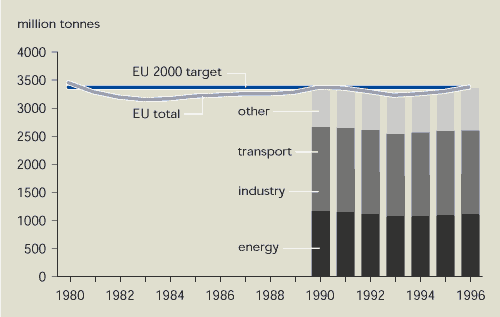
Source: EEA
Note: The
2000 target is the fifth environmental action programme target of
stabilising carbon dioxide emissions at 1990 levels by
2000.
Total EU carbon dioxide emissions in 1996 were in line with
the 5EAP target of stabilising emissions at 1990 levels by 2000.
From 1990 to 1996, emissions decreased substantially only in
Germany and the UK and then due to specific circumstances. Total EU
emissions are projected to increase by 8 % between 1990 and 2010,
with the largest increase coming from the transport sector.
| Table 8.2: Carbon
dioxide emissions in EEA member countries |
| |
1990(million tonnes CO2 equivalent) |
1996(million tonnes CO2 equivalent) |
Change(%) |
| Austria |
62 |
64 |
3 |
| Belgium |
115 |
130 |
13 |
| Denmark |
53 |
74 |
40 |
| Finland |
59 |
66 |
12 |
| France |
396 |
409 |
3 |
| Germany |
1 015 |
919 |
-9 |
| Greece |
85 |
92 |
8 |
| Ireland |
31 |
35 |
13 |
| Italy |
431 |
448 |
4 |
| Luxembourg |
13 |
7 |
-47 |
| Netherlands |
161 |
186 |
15 |
| Portugal |
47 |
51 |
8 |
| Spain |
226 |
229 |
1 |
| Sweden |
55 |
63 |
14 |
| UK |
584 |
567 |
-4 |
| EU total |
3 333 |
3 340 |
0 |
| Iceland |
2.1 |
2.3 |
10 |
| Norway |
35 |
41 |
17 |
|
Source: UNFCCC, 1998; UNFCC, 1999a;
EEA |
Notes: If
electricity import/export corrections were taken into account, the
estimates for Denmark would be 59 million tonnes in 1990 and
61 million tonnes in 1996. Emissions from land-use change and
forestry (LUCF) are included, but removals are excluded (see Table
8.1).
The projected EU carbon dioxide emissions for
2010 based on the pre-Kyoto baseline scenario are about 8 % above
the 1990 level (EEA, 1999a). Transport is the fastest-growing
sector, with emissions forecast to increase by 39 % above the 1990
level by 2010. The negotiated agreement with the car industry to
reduce carbon dioxide emissions from new passenger cars is not
included in the pre-Kyoto baseline scenario. In contrast,
industrial carbon dioxide emissions are forecast to decrease by 15
% between 1990 and 2010. Emissions from the domestic/tertiary
sector are projected to remain stable due to changes in the market
for electrical and heating equipment. Emissions in the power/heat
production sector are projected to remain at 1990 levels until
2010, when some increase is expected due to infrastructure changes,
such as the retirement of nuclear power plants at the end of their
lifetime. Only Germany, Luxembourg and the UK and are projected to
have lower carbon dioxide emissions in 2010 than in 1990.
Both in 1995 and in the baseline scenario for
2010, about 50 % of carbon dioxide emissions are related to the
combustion of liquid fuels. The relatively small increase (+8 %) in
total carbon dioxide emissions compared with the larger projected
increase in total energy consumption between 1995 and 2010 is
explained by the significant shift that is occurring from solid to
gaseous fuels.
8.2.3. Methane
Total EU methane emissions fell by 12 % between
1990 and 1996 (Figure 8.4), but with considerable variation
between Member States. Emissions from Germany and the UK fell by 36
% and 23 % respectively, but large increases occurred in Italy and
Spain.
The main sources of methane emissions in the EU
during this period were: agriculture (45 %), particularly from
ruminant animals (enteric fermentation and manure management);
waste treatment and disposal (36 %); and other sources (17 %),
mainly coal mining and leakage from natural gas distribution
networks. Estimates for methane emissions are much more uncertain
than those for carbon dioxide emissions as the main sources
(agriculture and waste treatment) are not well quantified.
The largest reduction in emissions appears to
be due to the decline of deep mining in the UK – and to some extent
in Germany – and the replacement of old gas-distribution pipework.
Agricultural emissions also fell, mainly due to a reduction in the
number of dairy cows (AEA, 1998a).
Methane emissions in EU Member States are
projected, under a baseline scenario, to decrease by 8 % between
1990 and 2010 (EEA, 1999a; AEA, 1998a), mainly due to a large
reduction in emissions from coal mining (as coal production
declines) and from agriculture (as cattle numbers fall). Reductions
from the waste sector, for example through measures to collect and
remove landfill gas, are not included in this baseline
scenario.
Figure 8.4:
Total EU emissions of methane
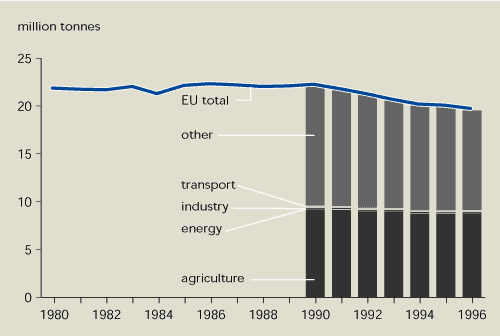
Source:
EEA
Notes:
‘Other’ includes coal mining and leaks from natural gas
distribution networks and waste treatment/disposal.
Total EU methane emissions have fallen since 1990, but mainly due
to specific circumstances in Germany and the UK. Emissions are
projected to decrease by 8 % between 1990 and 2010.
8.2.4. Nitrous oxide
Total EU nitrous oxide emissions were 2 %
lower in 1996 than in 1990 (Figure 8.5). However, this trend
varies considerably between Member States. The main sources of
nitrous oxide emissions in the EU are: fertilised agricultural land
(46 %); industry (28 %), particularly adipic acid and nitric acid
manufacture; transport (5 %); and energy (5 %). Emissions from the
transport sector are due to three-way catalysts in passenger cars
which reduce emissions of nitrogen oxides, carbon monoxide and
hydrocarbons, but as a side-effect, increase nitrous oxide
emissions. Emissions data for nitrous oxide is much more uncertain
than for carbon dioxide and methane primarily because the major
source (agriculture) is not well quantified.
The largest reductions appear to be due to
falling production levels for adipic and nitric acid in industry
and less use of inorganic nitrogenous fertilisers in agriculture.
These reductions were partly offset by an increase in transport
emissions as the number of cars with catalytic converters increased
(AEA, 1998b).
Total EU nitrous oxide emissions are projected,
under a baseline scenario, to increase by 9 % between 1990 and 2010
(Ecofys, 1998b; EEA, 1999a), mainly due to increases in emissions
from cars with catalytic converters. In this baseline scenario, no
reductions are assumed from the industrial sector and only minor
reductions from agriculture.
Figure 8.5:
Total EU emissions of nitrous oxide
Source:
EEA
Since 1990, total EU nitrous oxide emissions have decreased
slightly. Emissions are projected to increase by 9 % between 1990
and 2010.
8.2.5. Fluorocarbons
Under the Kyoto Protocol, countries can
select either 1990 or 1995 as the base year for fluorocarbon
emission reduction targets. Most EU Member States are expected to
choose 1995.
Total EU fluorocarbon emissions in 1995 are
difficult to estimate as not all EU Member States provided data.
Initial estimates suggest that total EU emissions in 1995 of the
three groups of Kyoto Protocol fluorocarbon gases (HFCs, PFCs and
sulphur hexafluoride) are about 58 million tonnes of carbon dioxide
equivalents (EEA, 1999a). This is about 1 % of total EU emissions
of total carbon dioxide, methane and nitrous oxide emissions in
1990 in terms of carbon dioxide equivalents (Ecofys, 1998a).
The largest contribution comes from HFCs (64
%), followed by sulphur hexafluoride (25 %). At present, HFCs are
mainly emitted as a by-product during the production of the
hydrochlorofluorocarbon, HCFC-22. HCFCs are not controlled under
the Kyoto Protocol, but under the Montreal Protocol for
ozone-depleting substances (Chapter 9). The most important
source of sulphur hexafluoride emissions is its use in switches in
electricity distribution. PFC emissions arise mainly from
production processes in the primary aluminium and the electronics
industry.
An indicative emission projection for the
halogenated gases has been prepared for the European Commission
using the limited information available and assuming a baseline
scenario (Ecofys, 1998a; March Consulting Group, 1998). In 2010,
total EU fluorocarbon emissions are projected to be about
82 million tonnes of carbon dioxide equivalents – an increase
of about 40 % compared with 1995 emissions of 58 million tonnes.
The contribution from HFCs is expected to increase to 79 %, while
the contributions from sulphur hexafluoride and PFCs are expected
to decrease to 15 % and 6 % respectively by 2010. The large
increase in HFC emissions is due to the use of HFCs as substitutes
for CFCs and other ozone-depleting substances whose use is being
phased out (see Chapter 9).
Fluorocarbon emissions are currently 1 % of total EU greenhouse
emissions. By 2010, they are projected to increase by 40 % from
1990 levels.
8.3. Temperature increase as an indication
of climate change
Between 1856 and 1998, yearly deviations from
the 1960-1990 global and European mean temperature (Figure 8.6)
show an increase of 0.3-0.6°C. The natural variations for Europe
are larger than those for the world average.
Globally, 1998 was the warmest year on record
and 1997 the warmest before that. This is partly due to the
1997-1998 El Niño/Southern Oscillation, the largest on record. This
phenomenon is a cycle of natural fluctuations of Pacific Ocean
temperatures, resulting in large-scale changes in tropical rainfall
and wind patterns. Partly because sea-surface temperatures in the
tropical Pacific have moved into a cool El Niño phase, the annual
global mean surface temperature in 1999 will, as expected, be
substantially lower than the record year of 1998. However, it is
still likely to be one of the highest 10 on record (DETR,
1999).
Under the mid-range (‘business-as-usual’)
scenario prepared by the Intergovernmental Panel on Climate Change
(IPCC), global carbon dioxide emissions are forecast to increase
from 1990 levels by about a factor of two by 2050 and a factor of
three by 2100 (IPCC, 1996). Increases in methane and nitrous oxide
emissions are projected to be smaller, but still substantial. On
this basis, the IPCC projects a 2°C increase in global mean
temperature by 2100 compared with 1990 (the uncertainty range is
1-3.5°C). Large regional variations are, however, possible.
There is no scientific consensus on sustainable
target values for the main indicators of the impact of climate
change. The EU has adopted a provisional ‘sustainable’ target of a
global average temperature increase of 2oC above the
pre-industrial level (European Community, 1996). This is below the
IPCC projections of a temperature increase of 2°C by 2100 compared
to 1990. Another proposed provisional ‘sustainable’ target is a
0.1°C temperature rise per decade (Leemans & Hootsman, 1998).
However, the IPCC projected rate of warming is more than double
this provisional ‘sustainable’ target. Under the IPCC’s baseline
emission scenario prepared in 1996, stable potentially
‘sustainable’ atmospheric concentrations of the main greenhouse
gases are unlikely to be realised by 2100. A reduction in global
carbon dioxide emissions of 50-70 % would be needed to stabilise
carbon dioxide concentrations in the atmosphere at 1990 levels by
2100.
Estimating the future of climate change using
scenarios has various sources of uncertainty. These include:
assumptions about socio-economic and sectoral developments;
anticipated potential reductions in greenhouse gas emissions; the
process of transforming emissions into climate change; and poorly
understood processes in current climate models. The latest
scientific knowledge on climate change will be described in the
IPCC’s Third Assessment Report, which is expected to be published
in 2000/2001.
Figure 8.6:
Observed global and European annual mean temperature deviations,
1856-1998
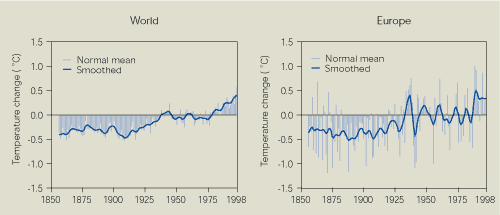
Source:
CRU, 1998
Notes:
Temperature plotted as the variation from the 1960-1990 mean. The
bars show the annual average as the variation from the 1960-1990
mean and the line the 10-year smoothed trend.
Global mean temperature has increased by about 0.3-0.6°C over the
past 100 years. Climate models estimate temperature increases,
above 1990 levels, of about 2°C by the year 2100, thus exceeding
the EU’s provisional sustainability target.
8.4. Current policies and measures
A number of existing EU and Member State
policies and measures aim to either reduce greenhouse gas emissions
or to enhance carbon sinks.
These include:
- energy/carbon dioxide taxes in various
Member States (no agreement has been reached on a comprehensive
EU-wide energy products tax);
- a negotiated agreement between the
European Commission and the car industry to reduce carbon dioxide
emissions from new passenger cars by 25 % between 1995 and
2008;
- the requirement of the Integrated
Pollution Prevention and Control (IPPC) Directive to use Best
Available Technology and to improve energy efficiency;
- the requirement of the Landfill
Directive to reduce the amount of organic waste landfilled (thus
reducing methane emissions)and to collect landfill gas for energy
use;
- EU energy-efficiency demonstration
programmes (ALTERNER, SAVE and JOULE-THEMIE);
- several Directives on energy-efficiency
requirements for appliances and various agreements with
manufacturers and importers on minimum energy
standards.
8.5. Possible future responses
According to the latest estimates, the
additional effort required to meet the EU’s Kyoto Protocol target
is some 600 million tonnes of carbon dioxide equivalents (see
Section 8.2.1; EEA, 1999a; European Commission, 1999b). An
important element of EU climate-change policy will be the
cost-effectiveness of different policies and measures. Other
important criteria for the selection and implementation of measures
include political acceptability, fairness (e.g. between sectors),
social barriers and industrial competitiveness.
As noted in the Communication on the
preparations for implementing the Kyoto Protocol, common and
coordinated policies and measures at Community level are expected
to be necessary to complement national initiatives (European
Commission, 1999b). Possible new policies and measures, additional
to those already agreed, are summarised in Table 8.3. Some of
these are already being planned or implemented by various Member
States.
The potential reduction from national and
Community measures could be more than sufficient to achieve the
EU’s Kyoto target (European Commission, 1999b). Over half the
required reductions could be achieved at low cost (less that EUR 5
per tonne of carbon dioxide equivalents). However, the distribution
of costs will vary significantly between economic sectors and
Member States.
According to a preliminary analysis (EEA,
1999b; EEA, 1999c), the total forest carbon sink for EU Member
States is 1-10 million tonnes of carbon per year (0.1-1 % of
total EU carbon dioxide emissions). Forest carbon sinks can
therefore only form a minor part of the policies and measures
needed to achieve Kyoto Protocol commitments. However, the
potential for carbon sequestration by forests is more significant
in some countries than in others.
| Table 8.3 Possible future EU policies
and measures to reduce greenhouse gas emissions |
| Greenhouse gas |
Sector |
Policies and measures |
Linked with indicator |
| Carbon dioxide |
Transport |
Passenger cars: negotiate agreements with manufacturers in Japan
and Korea, and companies not members of the European Automobile
Manufacturers Association (ACEA)
Freight transport by road: intermodal freight transport; fair
and efficient pricing
Aircraft: taxation of fuel; operational measures
|
|
| |
Industry |
Improved energy efficiency in industry through environmental
agreements
More use of combined heat and power (CHP) generation
|
Fig. 7.1.
Fig. 4.6.
|
| |
Energy |
Reduce/remove fossil fuel subsidies
More fuel switching
Greater energy efficiency
More use of combined heat and power (CHP) generation
Greater share of renewables in primary energy consumption (i.e.
12 % in 2010)
|
Fig. 3.3.
Fig. 3.2.
Fig. 4.6.
Fig. 3.4.
|
| |
Household |
Extend energy
efficiency standards to other equipment |
|
| Methane |
Agriculture |
Improved manure management and
feed conversion efficiency |
Fig. 6.1. |
| |
Waste |
Recover energy from
landfill gas energy recovery. Reduce amounts of biodegradable waste
going to landfill (already a requirement of the Landfill
Directive) |
Fig. 11.3. |
| |
Energy |
Reduce natural gas
leakage |
Fig 3.1. |
| Nitrous oxide |
Agriculture |
Reduce fertiliser application and
improve manure management |
Fig. 6.3. |
| |
Industry |
Install Best
Available Technology (BAT) for adipic acid and nitric acid
production |
|
| |
Transport |
Reduce emissions from
passenger car catalysts |
|
| Fluorocarbons |
Industry |
Reduce HFC formation as a by-product of HCFC-22 production
Specific measures to reduce other fluorocarbon emissions
|
|
8.6. Indicator development
The main requirement is to improve the
reliability of time series and to reduce uncertainty in estimates
of greenhouse gas emissions. Current knowledge suggests an order of
uncertainty of: ±5 % for carbon dioxide from fossil fuels; ±10 %
for total carbon dioxide emissions (including the very uncertain
emissions from land-use change and forestry); ±20 % for
fluorocarbons; ±20-50 % for methane; and ±50-100 % for nitrous
oxide. However, there is less uncertainty associated with emission
trends and these are considered reasonably robust.
National efforts are also required to improve
the completeness of the time series for their greenhouse gas
emission estimates and to achieve consistency by applying the same
methodology to all years.
For the future, more and improved climate
change impact indicators with particular relevance for Europe will
be considered. Such indicators, to be selected on the basis of
ongoing European research and IPCC activities, could include
temperature increase, radiative forcing, precipitation, sea-level
rise and water resources.
Analysis of the impact of energy taxes, of
subsidies to encourage more environment-friendly fuels and reduce
emissions, and of other aspects of emission-reduction programmes is
needed in the future to evaluate the effectiveness of response
measures.
8.7. References and further reading
AEA (1998a). Options to reduce methane
emissions. Report prepared for the Commission (DG
Environment). UK.
AEA (1998a). Options to reduce methane
emissions. Report prepared for the Commission (DG
Environment). UK.
AEA (1998b). Options to reduce nitrous
oxide emissions. Report prepared for the Commission (DG
Environment). UK.
CRU (1998). Climate Research Unit University of
East Anglia, UK.
www.cru.uea.ac.uk/cru/data/temperat.htm.
DETR (1999), Climate change and its impact:
stabilisation of carbon dioxide in the atmosphere. Prepared by
the Hadley Centre, The Meteorological Office, UK for the Department
of the Environment, Transport and the Regions, UK.
Ecofys (1998a). Reduction of the emissions
of HFCs, PFCs and sulphur hexafluoride in the EU. Report
prepared for the European Commission by Ecofys, the
Netherlands.
Ecofys (1998b). Emission reduction
potential and costs for methane and nitrous oxide emissions in the
EU. Report prepared for the European Commission by Ecofys, the
Netherlands.
EEA (1999a). Environment in the European
Union at the turn of the century. European Environment Agency,
Copenhagen.
EEA (1999b). Overview of national
programmes to reduce greenhouse gas emissions. Topic report no
8. European Environment Agency, Copenhagen.
EEA (1999c). Case study on carbon dioxide
sinks of forests, European Forest Institute. Technical Report
no 35. European Environment Agency, Copenhagen.
European Commission (1998). Communication
on implementing the Community strategy to reduce carbon dioxide
emissions from cars: an environmental agreement with the European
automobile industry.COM(1998)495.European Commission,
Brussels.
European Commission (1999a). Communication
on climate change – preparing for implementation of the Kyoto
Protocol. COM(99)230. European Commission, Brussels.
European Commission, (1999b). Council
Directive 1999/31/EC of 26 April 1999 on the landfill of
waste. Official Journal L 182 , 16.07.1999. European
Commission, Brussels.
European Community (1996). Council
conclusions on climate change, June 1996. European Commission,
Brussels.
European Community (1998). Council
conclusions on climate change. June 1998. European Commission,
Brussels.
European Community (1999). Council
conclusions on climate change. May 1999. European Commission,
Brussels.
IPCC (1996). Second assessment climate
change 1995, report of the Intergovernmental Panel on Climate
Change. ‘The Science of Climate Change’, Contribution of Working
Group 1. ‘Impacts, Adaptations and Mitigation of Climate Change’,
Contribution of Working Group 2. ‘Economic and Social Dimensions of
Climate Change’, Contribution of Working Group 3. World
Meteorological Organisation. United Nations Environment Programme.
Cambridge University Press.
IPCC (1999). Aviation and the global
atmosphere, a special report of working groups 1 and 3 of the
Intergovernmental Panel on Climate Change, World
Meteorological Organisation. United Nations Environment Programme.
Geneva.
IPCC/OECD/IEA (1999). Programme for
national greenhouse gas inventories: good practice in inventory
management. Intergovernmental Panel on Climate Change.
Organisation for Economic Co-operation and Development.
International Energy Agency. Paris.
Leemans, R. and Hootsman, R. (1998).
Ecosystem vulnerability and climate protection goals. Report
no. 481508004. RIVM, the Netherlands.
March Consulting Group (1998).
Opportunities to minimise emissions of hydrofluorocarbons from the
EU. Draft report prepared for the Commission. UK.
UNFCCC (1998). Second compilation and
synthesis of second national communications from Annex I
Parties, 6 October 1998, FCCC/CP/1998/11/Add.1 and Add.2) and
Summary compilation of annual greenhouse gas emissions
inventory data from Annex 1 Parties, 31 October 1998,
FCCC/CP/1998/INF.9, UNFCCC Secretariat, Bonn.
UNFCCC (1999a). Report on national
greenhouse gas inventory data from Annex 1 Parties for 1990 to
1997, UNFCCC Secretariat, Bonn.
UNFCCC (1999b). Report of the Conference of
Parties on its fourth session, held at Buenos Aires 2-14 November
1998, part 2: Action taken by the conference of Parties,
FCCC/CP/1998/16/Add.1., UNFCCC Secretariat, Bonn.

Document Actions
Share with others