3.3.
Reservoir and Lake Eutrophication
The characteristics of the
eutrophication processes in reservoir and lakes, are quite specific in the semi-arid areas
of the EEA. Not only do the problems derived from eutrophication affect both the quality
of water for irrigation and human consumption, but they also have an adverse effect on the
river and reservoir fauna.
An increase in nutrients (nitrogen
and phosphorus), and thus eutrophication in semi-arid areas, is enhanced by temperature
and light, which are the two predominant factors in biological production. Phosphorus is
usually the main nutrient responsible for freshwater eutrophication, whereas nitrogen is
the primary nutrient causing eutrophication of coastal areas and seas.
In contrast to the wet areas of
Europe, potential evapotranspiration exceeds precipitation in the semi-arid zones. As
result, many reservoirs and lakes lose large amounts of water of good quality not replaced
by precipitation. The concentration of salts reaches much higher levels than in the wet
zones, particularly those salts (phosphorus) which serve as nutrients for algae.
In most cases in semi-arid zones
there is a natural tendency for reservoirs to lose their oligotrophic characteristics
unless they are much more closely monitored and protected by legislation than in the wet
zones. The eutrophic and mesotrophic levels are often high, without this having been
induced by major incidences of contamination.
Erosion of the basins is another
phenomenon that produces eutrophication, because this brings about an increasing
accumulation of sediment in the reservoir which, in turn, gives rise to a greater exchange
between the dissolved elements present in the water and the materials lying on the bed.
The fact that the water resources
are scarce in semi-arid areas, means that there is a greater degree of water re-use and,
therefore, are more susceptible to eutrophication processes than the areas having more
abundant supplies.
3.3.1. Spain
The General Directorate of Hydraulic
Works has carried out fieldwork to measure and study the limnological state of its
reservoirs. Data are available for 411 reservoirs which, although this accounts for over
40% of the total, have been chosen so that they cover 85% of the countrys water
storage capacity. By extrapolating the results obtained from this limnological survey, it
can be deduced that 31% of the reservoirs, containing 40% of the water volume stored, are
eutrophic. Such figures are self-explanatory when comes to assessing the seriousness of
the problem (MOPTMA, 1993). Table 3.3-1 summarises the outcome of the study.
Table 3.3.-1 Trophic status of
studied Spanish reservoirs.
Trophic
status |
Number
of reservoirs |
Percentage
(%) |
Oligotrophic (O) |
89 |
22 |
Oligo/Mesotrophic
(O/M) |
56 |
13 |
Mesotrophic (M) |
89 |
22 |
Meso/Eutrophic (M/E) |
50 |
12 |
Eutrophic (E) |
127 |
31 |
Total |
411 |
100 |
A total of 113 reservoirs out of the
411 studied ones are located in basins having water scarcity problems. Table 3.3-2 shows
the trophic status of reservoirs that are located in semi-arid areas in Spain.
Table 3.3.-2 Trophic status of
reservoirs in semi-arid basins
Trophic status |
Basin |
O |
O/M |
M |
M/E |
E |
Total |
Guadiana |
2 |
4 |
1 |
10 |
8 |
25 |
Guadalquivir |
3 |
3 |
7 |
8 |
20 |
41 |
Sur |
- |
2 |
3 |
1 |
1 |
7 |
Segura |
5 |
3 |
3 |
- |
2 |
13 |
Júcar |
6 |
3 |
6 |
8 |
4 |
27 |
Total |
16 |
15 |
20 |
27 |
35 |
113 |
In view of Table 3.3-2, 31% of the
reservoirs in semi-arid areas have eutrophication problems. This figure is the same that
the percentage calculated for the total studied reservoirs. Therefore the eutrophication
is a major problem in southern areas of Spain. To group the reservoirs into the same
trophic degree, different criteria have been taken into account, such as CarlsonŽŽŽŽs index,
dissolved oxygen distribution, total nutrient content, plankton composition, chlorophyll-a
concentration and the probability distribution curves of trophic degree by OECD 1982.
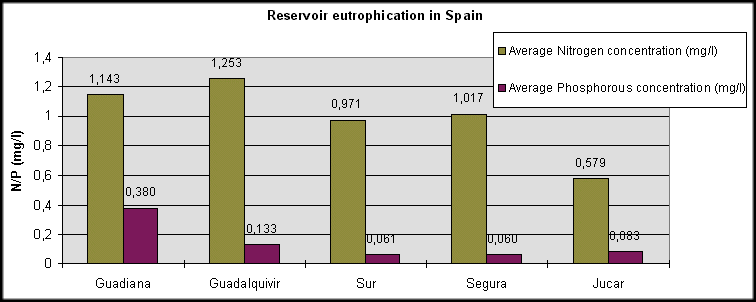
Figure 3.3-1 shows the average
annual concentrations of nitrogen and phosphorus in the reservoirs located in semi-arid
basins. Data correspond to the average concentration of nitrogen and phosphorus in the
sampled reservoirs of each basin, therefore, a mean concentration is obtained for each
semi-arid catchment area.

Figure 3.3.-1 Nitrogen
and Phosphorus concentration in Spanish reservoirs.
Apart from assessing nitrogen and
phosphorus concentration, other indicators for determining whether or not the reservoirs
have eutrophication problems are the existence of stratification, the mean oxygen
concentration measured close to the bottom
and the mean surface chloride concentration. Table
3.3.-3 shows the figures related to these features.
The Guadalquivir catchment area
appears to have reservoirs with major eutrophication problems; 49% of the reservoirs are
eutrophic and have the highest surface chloride average concentrations and the lowest
value of oxygen measured in deep waters. The average nitrogen concentration is also high,
(maximum 8.4 mg/l). On the other hand, the reservoirs located in the Jucar and Sur
catchment areas are in a better situation, the latter having high values of oxygen
measured at low depth, and low values of surface chloride.
3.3.2. Portugal
The Directorate of Water Resources
in Portugal has carried out a classification of the trophic state of Portuguese
reservoirs. As a result of these works, 62 reservoirs turn out to be classified as being
oligotrophic and only 10 show eutrophication problems.
Data from Portuguese reservoirs are
summarised in table 3.3-4 (INAG, 1995b):
Table 3.3.-3 Main
characteristics of sampled reservoirs in Spanish semi-arid basins (*).
| Basin |
Nitrogen |
Phosphorus |
Cl |
Strat. |
O2 |
Name |
Tot.
No. |
No. |
Aver. |
Min. |
Max |
No. |
Aver. |
Min. |
Max |
Aver. |
No. |
Aver. |
Guadiana |
88 |
23 |
1.143 |
0.080 |
3.686 |
8 |
0.380 |
0.065 |
1.242 |
8.476 |
8 |
7.391 |
Guadalquivir |
52 |
41 |
1.253 |
0.192 |
8.400 |
14 |
0.133 |
0.030 |
0.260 |
10.44 |
17 |
3.390 |
Jucar |
46 |
27 |
0.579 |
0.014 |
2.230 |
4 |
0.0832 |
0.044 |
0.160 |
8.5 |
15 |
8.770 |
Segura |
30 |
13 |
1.017 |
0.331 |
1.907 |
4 |
0.060 |
0.040 |
0.080 |
10.36 |
9 |
6.0 |
Sur |
34 |
7 |
0.971 |
0.263 |
1.832 |
3 |
0.061 |
0.055 |
0.068 |
6.0 |
2 |
57.67 |
(*) Notes to the headings of
columns:
Basin:
Tot. No is the total number of reservoirs in the basin;
Nitrogen: No. is the number of sampled reservoirs; Aver. is the
mean average concentration in mg/l; Min. is the minimum average concentration in mg/l;
Max. is the maximum average concentration in mg/l.
Phosphorus: The same as for Nitrogen;
Cl: Aver. is the mean average surface Chloride concentration in
mg/m3;
Strat: No. is the number of reservoirs having water
stratification;
O2: Aver. is the average of the minimum value of Oxygen
concentration in deep waters -in mg/l- obtained from different sampling campaigns.
Table -4 Trophic status of
Portuguese reservoirs and lakes.
Trophic status |
Number of reservoirs |
Percentage (%) |
Oligotrophic |
62 |
77 |
Mesotrophic
(M) |
7 |
9 |
Meso/eutrophic
(ME) |
2 |
2 |
Eutrophic
(E) |
10 |
12 |
As can be observed from Table 3.3-2
and Table 3.3-4, the eutrophication problems in Portuguese reservoirs are not as serious
as in the Spanish ones.
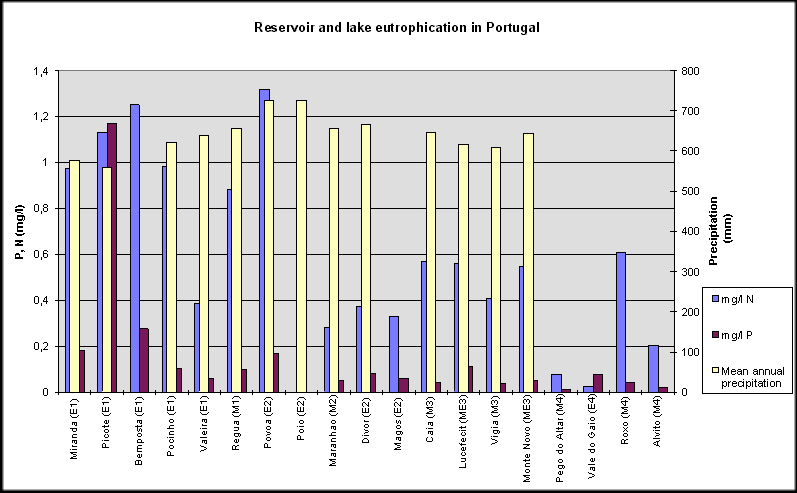
Figure 3.3-2 shows the data
concerning reservoir and lake eutrophication in Portugal (INAG, 1995b).

Figure
3.3.-2 Reservoir and lake eutrophication in Portugal
In Figure 3.3-2 the mean annual
concentrations of nitrogen and phosphorus are expressed by lake or reservoir, as well as
the mean annual precipitation. Close to the name of each lake or reservoir, the eutrophic
degree (E, M or ME) and the region number (1 to 4) to which the reservoir belongs are
stated. (See Table 2.2-1).
Reservoirs having major
eutrophication problems are located in regions 1 (Alto Douro) and 2 (Sul Tejo). The
trophic degree has been assessed according to the chlorophyll-a concentration, the Secchi
disk depth and the content of phytoplankton in water.
3.3.3. Italy
In the island of Sardinia, there are
four lakes with eutrophication problems. Table 3.3-5 indicates the concentration of
phosphorus and nitrogen in mg/m3.
Table -5 Reservoir and lake
eutrophication in Sardinia
Lake/reservoir
name |
P
(mm) |
E
(mm) |
N
(mg/m3) |
P
(mg/m3) |
Flumendosa |
741 |
1084 |
142(*)-153(**) |
14(*)-19(**) |
Mulargia |
741 |
1084 |
120(*)-309(**) |
24(*)-34(**) |
Cizerri |
498 |
1737 |
757 |
62 |
Simnirizzi |
498 |
1737 |
1269 |
65 |
Notes:
(*) Sampled between 0 and 15
m. depth.
(**) Sampled between 20 and 70 m. depth.
3.3.4. Greece
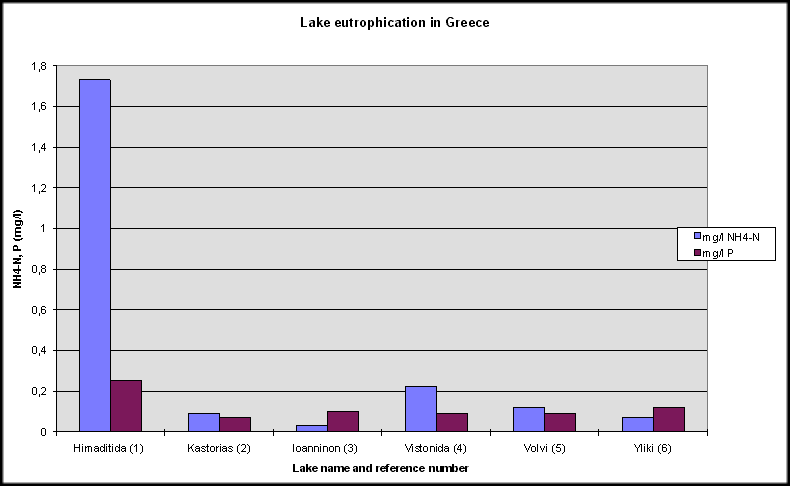
There are six lakes where
eutrophication is detected in Greece. Concentration of nitrogen is expressed as mg/l NH4-N,
ranging from 0.03 to 1.73 mg/l. phosphorus concentration ranges between 0.07 and 0.25 mg/l
P, on average since 1992. Figure 3.3-3 shows these data:

Figure 3.3.-3 Lake eutrophication
in Greece
Eutrophication problems in lakes
1,2,3 and 4 are due to wastewater discharges. Lake 5 is also receiving wastewater, and is
also located nearby an area having water scarcity problems (Central Macedonia). Lake 6,
located in the Attiki area, tends to have eutrophication problems, showing seasonal
increases in nutrient concentrations.


Document Actions
Share with others