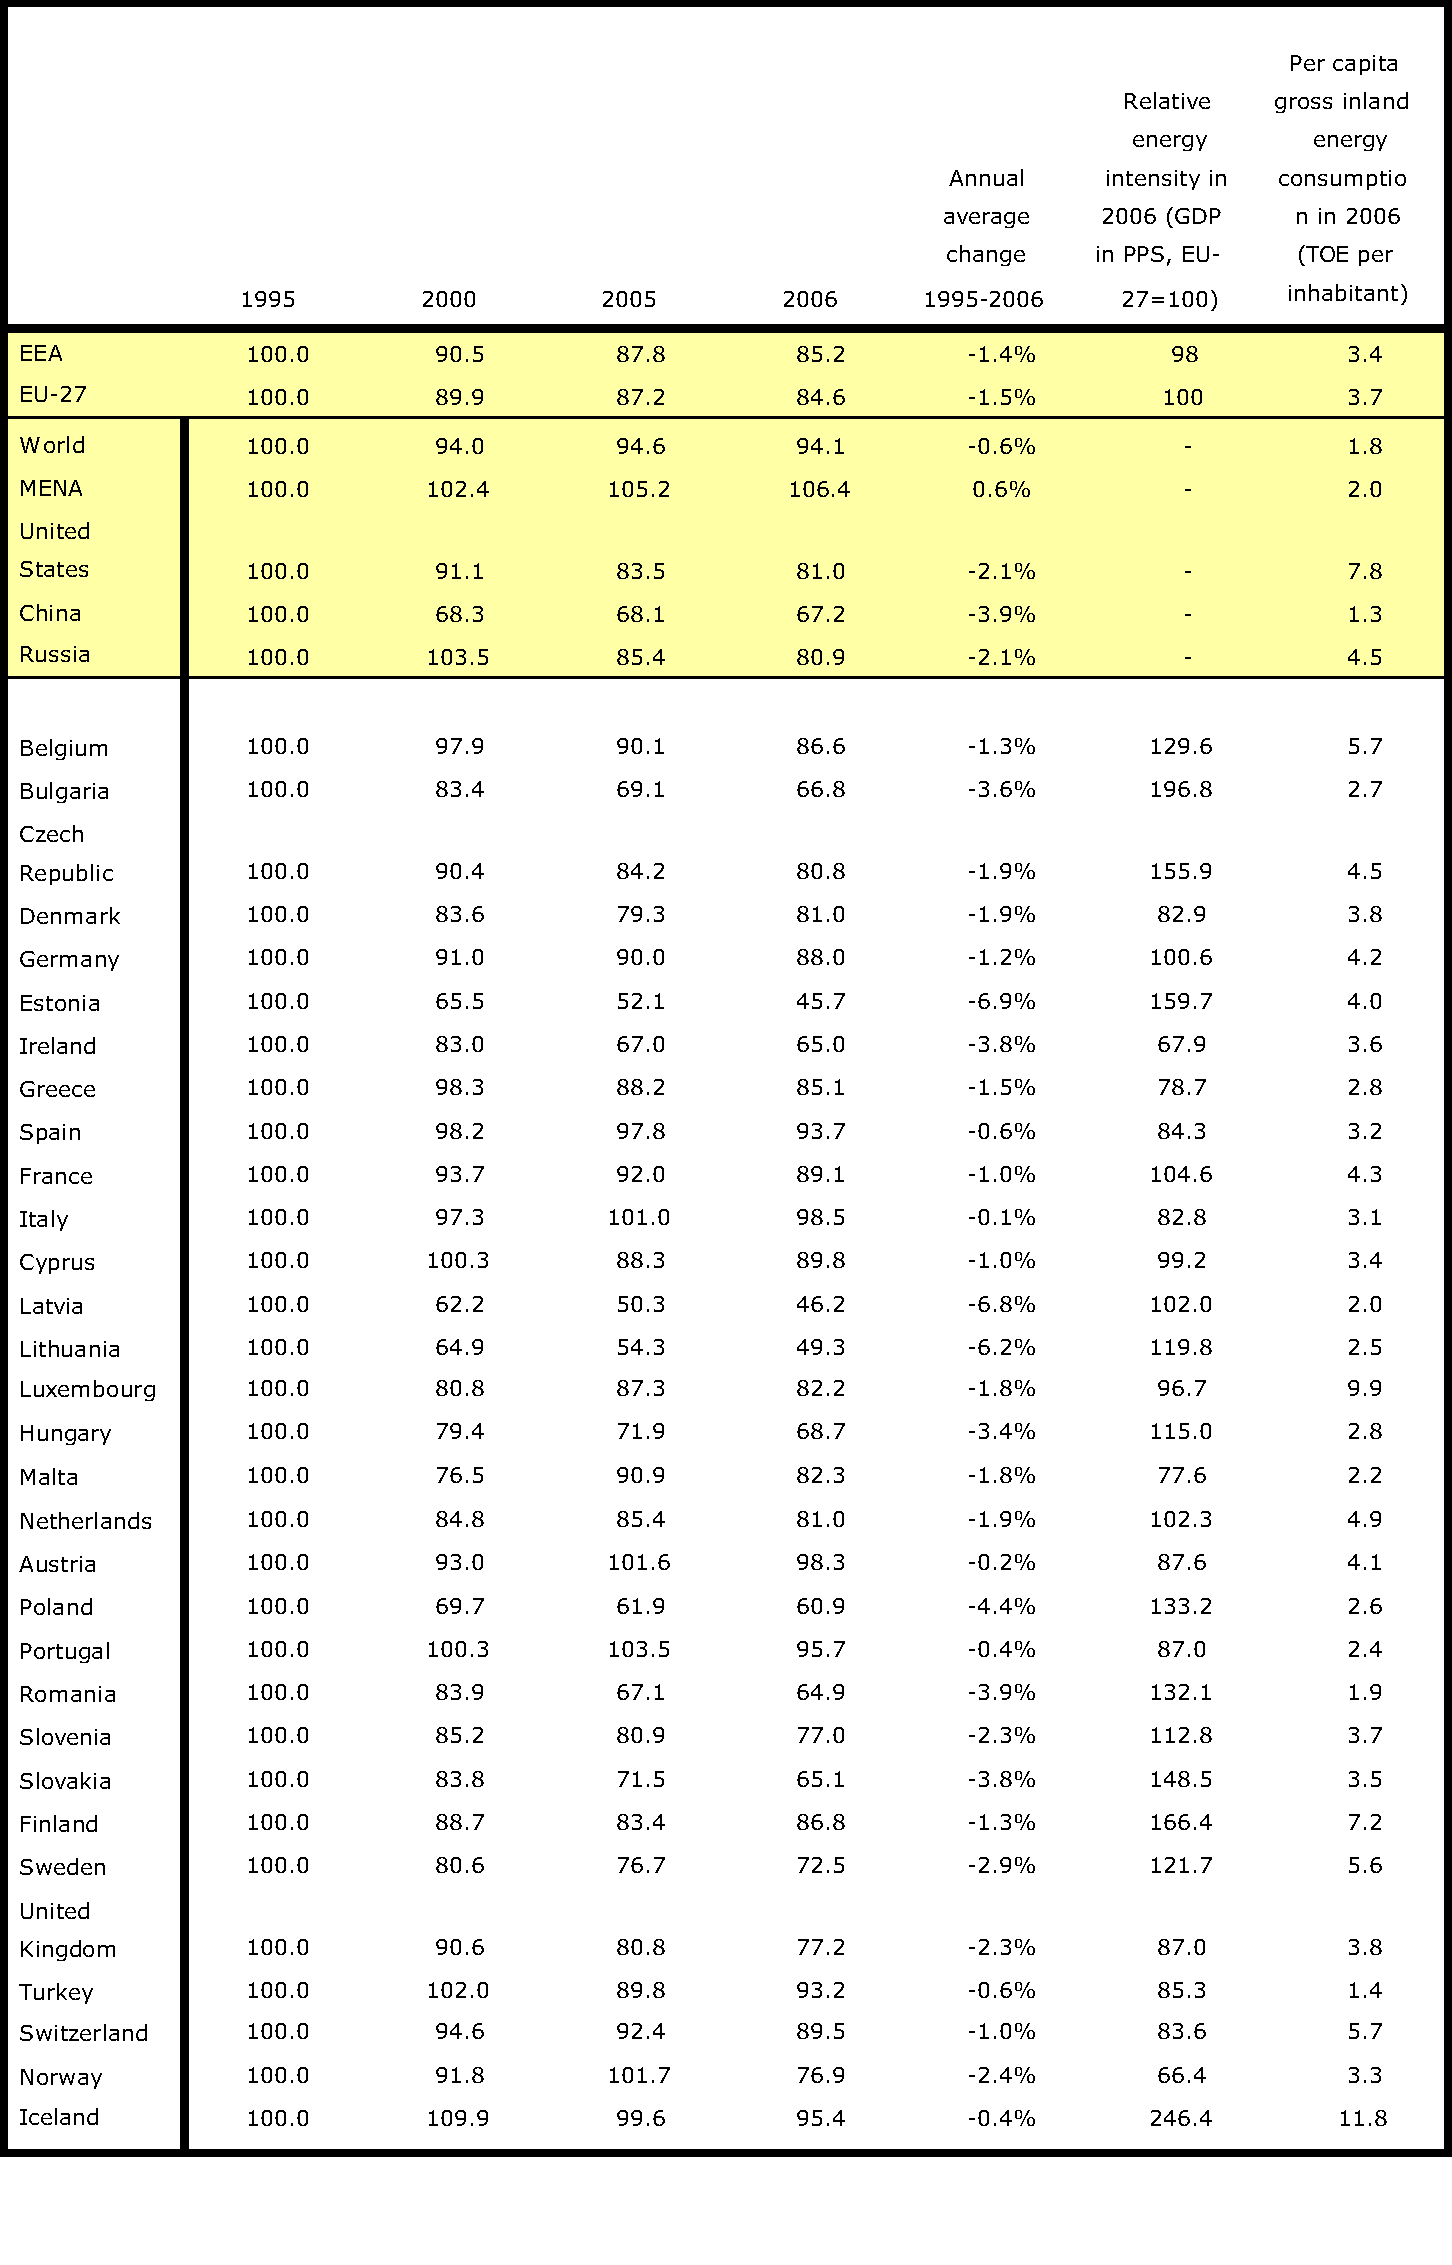
The second to last column shows the energy intensity measured in purchasing power standards relative to the EU-27. These are currency conversion rates that both convert to a common currency and equalise the purchasing power of different currencies (by analysing the prices paid in each country for a basket of similar goods and services). They eliminate the differences in price levels between countries, allowing meaningful volume comparisons of GDP. They are an optimal unit for benchmarking country performance in a particular year. No data was available from IEA for Djibouti and the Palestinian territories. Also no data was available from the United Nations Statistics Division for the World, Qatar and the Palestinian Territories. For Qatar and the world data from the IMF is used. TOE refers to Ton of Oil equivalent. MENA refers to Middle East and North Africa


Document Actions
Share with others