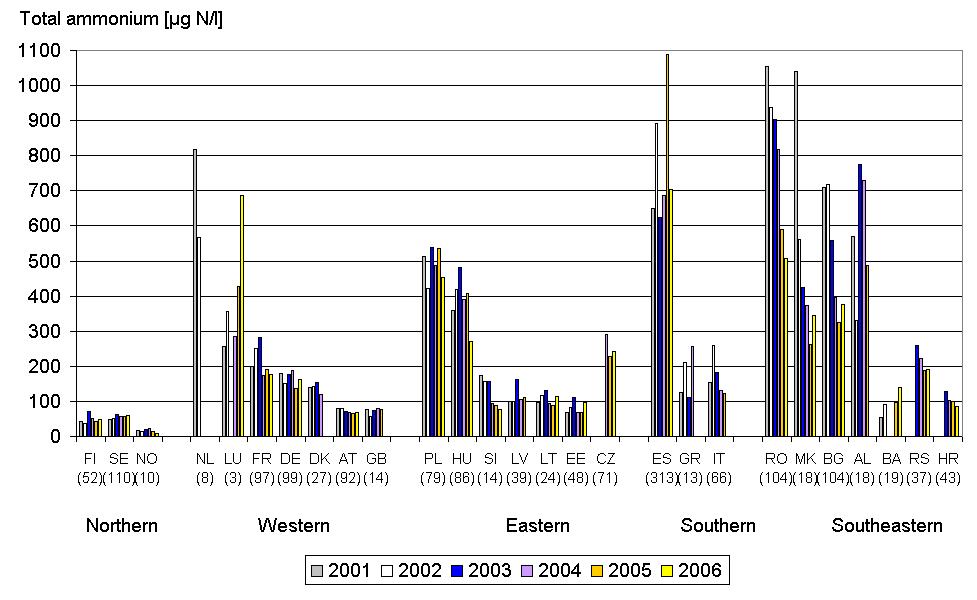
Concentrations by countries are expressed as the mean of the annual mean concentrations for the period 2001 to 2006. The figure shows the same number of stations per country as included in regions of Europe of Fig. 3 using consistent time series trends between 1992 and 2006 (Northern, Western and Eastern Europe), between 2000 and 2006 (Southern Europe) and between 2001 and 2006 (Southeastern Europe).
Countries with shorter consistent time series as given in Fig. 3 are added in this figure. These are Bosnia and Herzegovina (BA) (2001-2006), the Czech Republic (CZ) (2004-2006), Croatia (HR) (2003-2006), the Netherlands (NL) (2001-2002) and Serbia (RS) (2003-2006). In the brackets, the periods are noted for which consistent time series trends have been calculated using only stations that have recorded concentrations for each year included in the time series with an exception to Bosnia and Herzegovina (BA) having two years missing concentrations (2003, 2004).
Mean concentrations of Belgium (BE) are excluded from the graph having some annual concentrations higher than the figure maximum (1100 µg N/l): 1506 (2000), 985 (2001), 1118 (2002), 1442 (2003), 1117 (2004), 967 (2005), 996 (2006).


Document Actions
Share with others