Indicator 15 (and 16): Fuel prices and taxes
|
- Taxes are a major component of fuel price throughout
the EU. They are differentiated to encourage the use of unleaded petrol
- There is no common trend in overall fuel tax
level between Member States. Fuel taxes are therefore used to provide
incentives to shift demand from leaded petrol to more environment-friendly
fuels, but not generally to reduce overall fuel demand.
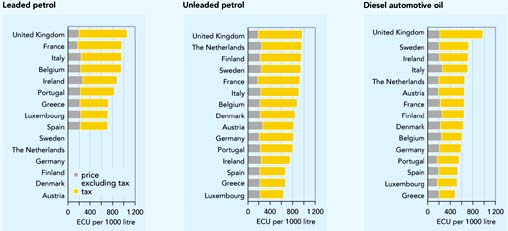
Figure 5.4: Price
structures for leaded and unleaded petrol and diesel automotive fuel (1998)
Source: Eurostat
Objective
Promote
environment-friendly fuels and reduce fuel consumption.
Definition
Fuel
price and the share of tax included in fuel price.
|
Policy and targets
Motor fuel is currently subject to a number of
different taxes, including VAT, excise duty, storage levies, security levies,
and environmental taxes. Fuel taxes provide means for reducing demand. Differentiation
in fuel taxes influences the choice of fuel (OECD, 1998).
The Mineral Oil Directive prescribes minimum
fuel taxes, differentiated between leaded petrol, unleaded petrol and diesel.
All EU Member States comply with this Directive and many countries impose even
higher taxes. Taxation of fuels is also an important component of the overall
EU transport policy to internalise all the costs of transport including environmental
costs.
Several initiatives are underway in Member States
to promote the use of taxes to manage other aspects of transport for example
to reduce congestion, accidents and pollution. Differentiated vehicle taxes
to improve the age profile and efficiency standard of the vehicle fleet are
used in the Netherlands and are under consideration in Ireland. In Germany,
the first phase of an eco-tax reform took place in 1999 with an increase in
fuel tax of 6 pfennig per litre this will be similarly incremented each year
until 2003. From 2001, fuel with a sulphur content of 50 ppm and over will be
subject to an additional tax of 3 pfennig per litre.
Findings
Figure 5.4 shows that fuel taxes vary greatly
between Member States. They account for 65-80 % of unleaded petrol price
and 60-80 % of diesel prices. The tax differentiation required in the Mineral
Oil Directive is reflected in fuel prices. Leaded petrol is the most expensive
in all countries (4-17 % more than unleaded petrol and up to 57 %
more than diesel in 1998), and diesel is the cheapest in most countries. Tax
differentiation has been a major factor in phasing out leaded petrol.
A recent report from ECMT (ECMT, 1999 draft)
finds that, as tax regimes vary between countries the level of fuel excise duty
raised in each does not provide a reliable indicator of the extent to which
infrastructure costs are being recovered.
Figure 5.5: Price of petrol and diesel automotive fuel
(1998)
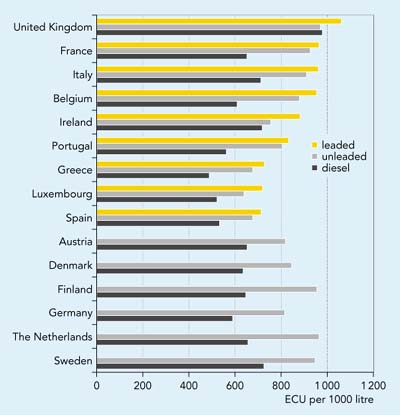
Source: Eurostat
The environmental performance of both petrol and diesel cars
will improve when tighter standards for new cars are introduced following EU
Directive 98/69 (regulating the emissions of carbon oxides, hydrocarbons, NOx
and particulate matter from diesel cars) and as a result of EU Directive 98/70
(regulating diesel fuels, including sulphur content). The Directive comes into
force shortly after year 2000 and will be strengthened (see Indicator 2).
Figure 5.6 shows changes in fuel prices since 1990. There
are large variations between Member States, and no overall trend. In most countries
prices have shown relatively little change in real terms since 1990. However,
in the Netherlands and the United Kingdom real prices of all fuels have risen
steadily, whilst in Greece diesel is more expensive than in 1990 (although it
has fallen from a peak in 1993). Real prices have fallen in several countries,
especially for diesel.
In 1998 unleaded fuel prices were highest in Finland, Sweden
and Italy, and lowest in Luxembourg, Greece and Portugal. Diesel prices follow
a similar pattern, except in the UK where the price is particularly high.
Fuel taxes are in many countries being supplemented with other
transport taxes and charges (e.g. road pricing, Eurovignette, vehicle registration
taxes, tolls). However, comprehensive harmonised data on transport taxes and
charges is not available (see Box 5.2).
Figure 5.6: Fuel price evolution 1990-1998
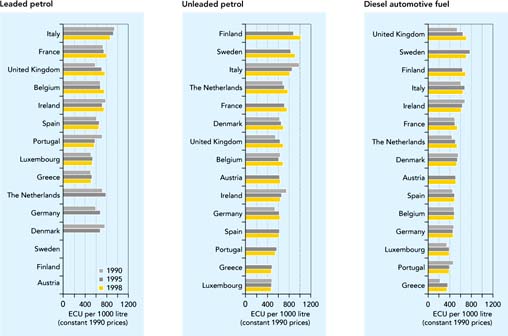
Source: Eurostat
|
Box 5.2: Transport taxes and charges - the future
TERM Indicator 16
In addition to fuel taxes, Member States apply
various other transport taxes and charges (CEC, 1997b);
taxes associated with buying, hiring, and registering
a vehicle (e.g. VAT and registration taxes);
other taxes payable in connection with the possession
or ownership of a vehicle (circulation taxes and insurance taxes);
taxes directly or indirectly related to the use
of vehicles (e.g. road and bridge tolls, Eurovignette).
When comparing revenues generated by transport
between countries and modes, all these forms of taxes and charges must
be included. However, lack of current harmonised data on these costs has
made it impossible to do so in this assessment.
Figure 5.7 shows how fuel taxes have a different
weight in the total burden of freight taxes and charges in each country.
An increase or decrease in fuel duty will therefore have a different effect
in each country. The figure is taken from a report prepared for the Federal
Swiss Transport Studies Service in 1997 which provides a methodological
basis for making comparisons between countries with widely differing systems
of taxation. The ECMT is currently updating this methodology and extending
it to rail transport and passenger transport.
The figure illustrates that some categories of
freight charge are applied in all countries, for example diesel excise
duty. Others (e.g. user charges such as tolls and Eurovignette) apply
only in certain countries. It cannot therefore be concluded that because
one country does not apply a particular charge it is under-recovering
infrastructure costs, or that it might be advisable to introduce the missing
charge. Finally, when comparing systems of taxation between countries,
or evaluating the impact of taxes on road transport other non-transport
categories of taxation (i.e. labour and capital taxation) must also be
taken into consideration.
Figure 5.7: Structure of revenues from road freight
transport
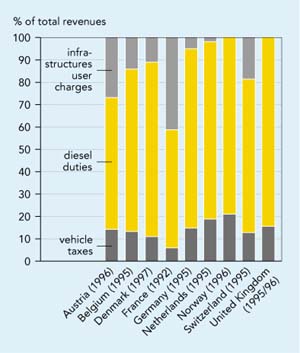
Source: ECMT (1999 draft), Ecosys
(1998)
|
Future work
- Eurostat collects price data for road transport fuel.
No information is available on the price of kerosene for aviation, either
from Eurostat, or from CONCAWE (the European oil industry organisation for
environment, health and safety). The significant environmental impacts of
aviation suggest that kerosene prices should be monitored.
- The European Commission recently proposed a means
of monitoring prices of petroleum products (CEC, 1998a).
- It is intended to extend this indicator to cover
transport taxes and charges other than fuel taxes (see Box 5.2). With the
exception of fuel prices and taxes, data on transport taxes and charges is
still unavailable or incomplete. It is expected that ongoing work by Eurostat/OECD
(regarding statistics on environmental taxes) and ECMT (on international comparison
of road and rail taxation) should soon yield the necessary data to compile
TERM Indicator 16 (transport taxes and charges).
|
Data
Sales price of road transport fuels
Unit: ECU per 1000 litre (1990 prices)
|
| |
Leaded petrol
|
Unleaded petrol
|
Diesel fuel
|
| |
1990
|
1995
|
1998
|
1990
|
1995
|
1998
|
1990
|
1995
|
1998
|
|
Austria
|
?
|
-
|
-
|
?
|
632.9
|
642,6
|
?
|
508.6
|
511,8
|
|
Belgium
|
685.5
|
685.2
|
754.8
|
643.6
|
615.2
|
695.6
|
479.8
|
486.2
|
481.9
|
|
Denmark
|
768.6
|
682.7
|
-
|
634.7
|
662.8
|
704.2
|
557.9
|
541.7
|
528.7
|
|
Finland
|
?
|
-
|
-
|
?
|
890.4
|
1022.0
|
?
|
637.9
|
692.1
|
|
France
|
734.6
|
750.7
|
798.0
|
?
|
722.4
|
766.3
|
492.3
|
494.2
|
539.5
|
|
Germany
|
597.0
|
685.0
|
-
|
545.2
|
628.2
|
637.5
|
473.9
|
457.1
|
461.2
|
|
Greece
|
508.4
|
530.0
|
512.3
|
?
|
493.6
|
476.8
|
222.1
|
363.6
|
343.6
|
|
Ireland
|
782.6
|
720.0
|
750.2
|
758.8
|
669.8
|
641.5
|
682.1
|
633.1
|
610.3
|
|
Italy
|
943.8
|
925.7
|
866.4
|
996.6
|
864.1
|
820.2
|
605.6
|
679.2
|
641.6
|
|
Luxembourg
|
512.9
|
546.0
|
535.2
|
491.4
|
482.2
|
474.9
|
345.1
|
391.1
|
388.2
|
|
Netherlands
|
722.3
|
786.5
|
-
|
692.0
|
721.0
|
783.5
|
440.8
|
503.5
|
533.3
|
|
Portugal
|
720.2
|
586.4
|
569.9
|
?
|
579.0
|
551.3
|
465.4
|
392.2
|
385.0
|
|
Spain
|
615.0
|
665.7
|
656.0
|
?
|
630.4
|
622.3
|
452.4
|
487.3
|
490.1
|
|
Sweden
|
?
|
-
|
-
|
?
|
838.4
|
916.8
|
?
|
772.9
|
702.4
|
|
United Kingdom
|
590.8
|
710.2
|
765.9
|
555.6
|
642.1
|
699.9
|
538.4
|
644.4
|
706.1
|
Note: Leaded
petrol is no longer sold in Austria, Denmark, Finland, Germany, Netherlands
and Sweden.
Source: Eurostat |
|
Price structure of road transport fuels (1998)
Unit: ECU per 1000 litre
|
| |
Leaded petrol
|
Unleaded petrol
|
Diesel petrol
|
| |
price excluding taxes
|
tax
|
sales price
|
price excluding taxes
|
tax
|
sales price
|
price excluding taxes
|
tax
|
sales price
|
|
Austria
|
-
|
-
|
-
|
271.6
|
546.8
|
818.5
|
192.9
|
458.9
|
651.8
|
|
Belgium
|
228.3
|
725.7
|
954.0
|
224.1
|
655.0
|
879.1
|
244.5
|
364.5
|
608.9
|
|
Denmark
|
-
|
-
|
-
|
228.4
|
617.1
|
845.5
|
227.4
|
407.4
|
634.8
|
|
Finland
|
-
|
-
|
-
|
226.8
|
727.8
|
954.6
|
256.3
|
390.1
|
646.5
|
|
France
|
173.7
|
790.0
|
963.7
|
183.3
|
742.1
|
925.4
|
222.2
|
429.3
|
651.5
|
|
Germany
|
-
|
-
|
-
|
208.7
|
605.8
|
814.5
|
209.7
|
379.6
|
589.3
|
|
Greece
|
213.1
|
513.5
|
726.6
|
223.9
|
452.4
|
676.3
|
203.3
|
284.1
|
487.4
|
|
Ireland
|
264.2
|
617.8
|
882.0
|
243.6
|
510.5
|
754.2
|
212.1
|
505.4
|
717.5
|
|
Italy
|
234.3
|
727.1
|
961.4
|
237.1
|
673.0
|
910.1
|
262.1
|
449.9
|
712.0
|
|
Luxembourg
|
230.1
|
489.4
|
719.5
|
226.0
|
412.4
|
638.4
|
172.9
|
348.9
|
521.8
|
|
Netherlands
|
-
|
-
|
-
|
250.5
|
713.3
|
963.8
|
195.8
|
460.2
|
656.0
|
|
Portugal
|
222.7
|
608.9
|
831.6
|
229.1
|
575.2
|
804.4
|
170.9
|
391.0
|
561.8
|
|
Spain
|
219.6
|
493.3
|
712.9
|
220.3
|
456.0
|
676.3
|
196.2
|
336.4
|
532.6
|
|
Sweden
|
-
|
-
|
-
|
245.9
|
700.6
|
946.6
|
203.4
|
521.8
|
725.2
|
|
United Kingdom
|
195.2
|
866.1
|
1061.2
|
193.1
|
776.7
|
969.8
|
216.0
|
762.4
|
978.4
|
Note: Leaded petrol
is no longer sold in Austria, Denmark, Finland, Germany, Netherlands and
Sweden.
Source: Eurostat |

Document Actions
Share with others