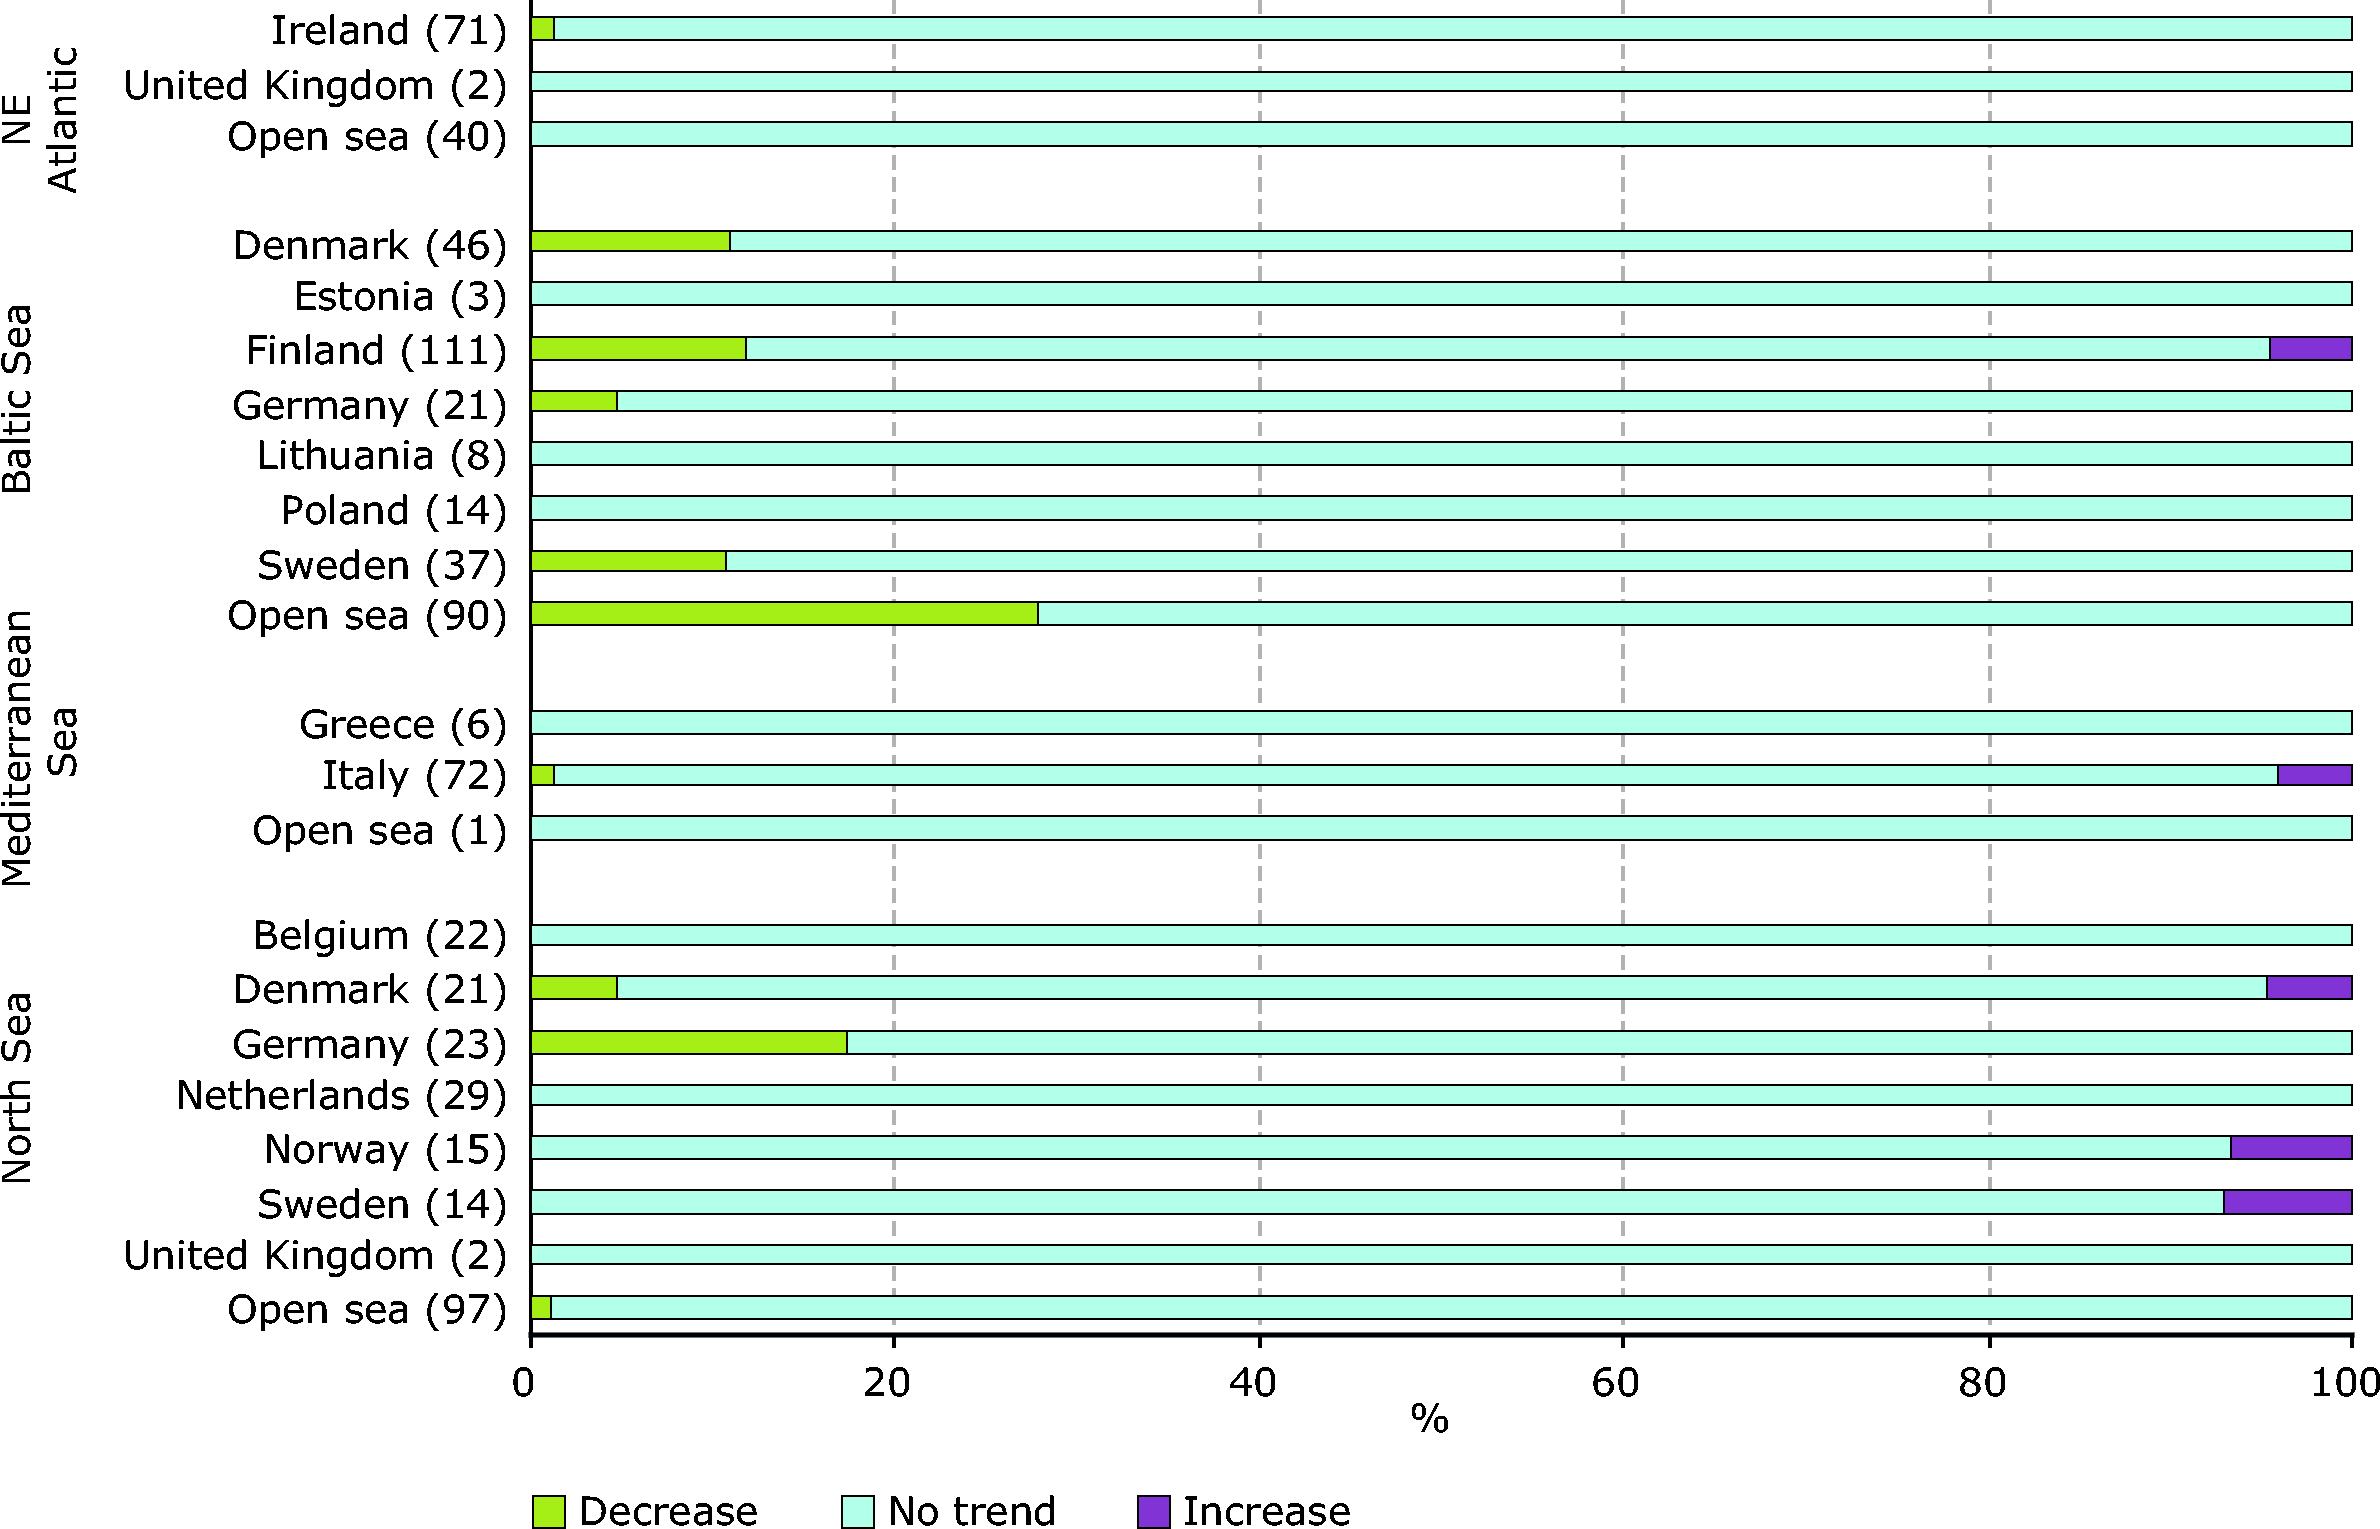
How to read the graph: in the North Sea, a little under 20 % of German stations identified a decrease of oxidised nitrogen concentrations. For some countries the data include stations with observations made in 2005, for some only up to 2004. The full data set is available at: http://themes.eea.europa.eu/IMS/ISpecs/ISpecification20041007132008/IAssessment1116503188454/view_ content [Accessed 23 June 2009] Countries included in the analysis: Belgium, Denmark, Estonia, Finland, Germany, Greece, Ireland, Italy, Latvia, Lithuania, Netherlands, Norway, Poland, Sweden and the United Kingdom. Bulgaria, France, Iceland, Malta, Portugal, Romania, Slovenia, Spain and Turkey reported time series of less than five years duration.


Document Actions
Share with others