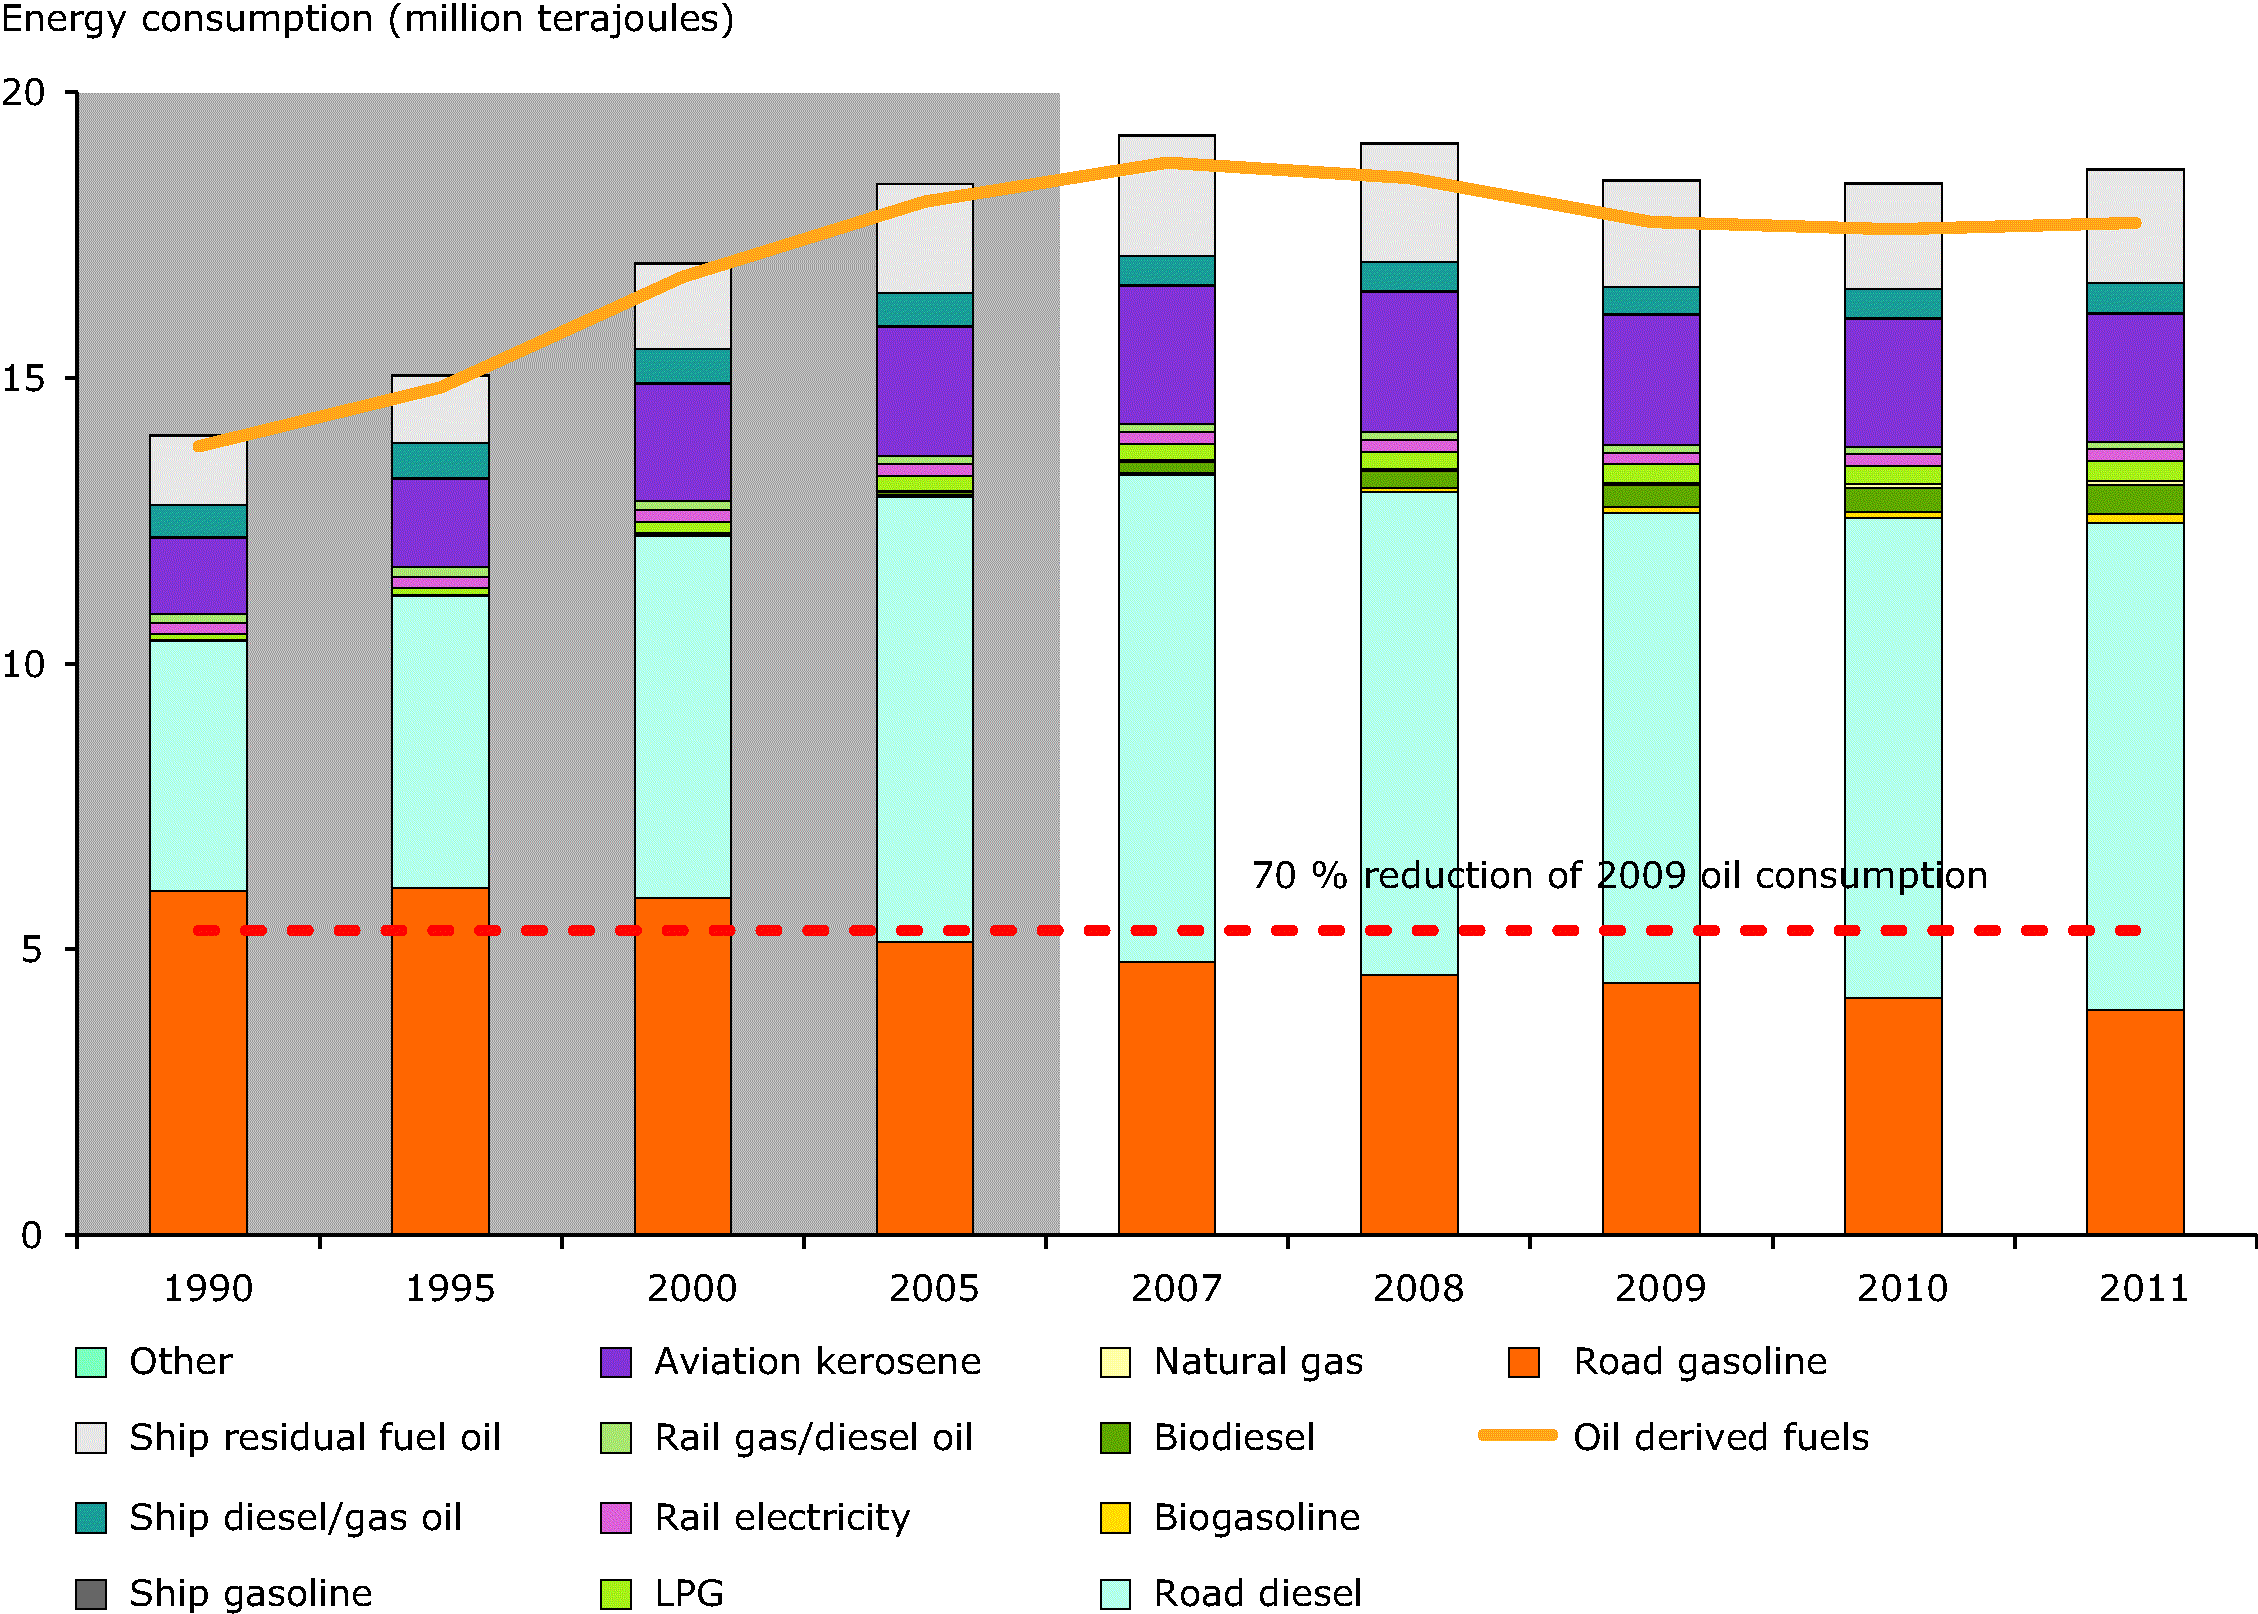
Energy statistics for transport are collected from Member States and collated by Eurostat. To assess whether the total energy from consumption from transport is growing, time series data for energy consumed was obtained from Eurostat. Data for various fuels was downloaded for ‘bunkers’ (sea), air (domestic and international), inland navigation, road transport and rail transport. Data for bunkers covers the quantities of fuel delivered to sea going vessels of all countries. Data for inland and coastal water is not included in bunkers (sea). Data for air covers quantities of fuel consumed in national and international air traffic. Energy consumed by electric and diesel trains is included within the rail data.
Since Eurostat data is being used to process statistics, the Eurostat methodology is to be referred to for data collection and specification (see Eurostat, ITF and UNECE, 2009).
Methodology for Gap Filling
No methodology for gap filling has been specified.
Methodology for Extrapolation
The final energy consumption time series contains an extrapolation to the latest available complete calendar year. The primary Eurostat dataset lags behind the last full calender year by one year. For example half way through 2012, the relevant Eurostat data is complete up to 2010. Based on Eurostat data, an extrapolation to the last complete calender year was made using up-to-date monthly data on supply and transformation of oil-based products. The following assumptions were used:
• Maritime bunker final energy consumption was assumed to correlate with internal market deliveries of maritime bunker fuels;
• Road transport final energy consumption was assumed to correlate with an energy-weighted combination of internal market deliveries of motor gasoline and transport diesel;
• Aviation final energy consumption was assumed to correlate with internal market deliveries of kerosene – jet fuel.
Example calculation for 2012 TERM report: using these assumptions, final energy consumption in 2011 is extrapolated by the formula:
[Final energy consumption 2011] = [Final energy consumption 2010] * [Internal market deliveries 2011] / [Internal market deliveries 2010]
For other modes, final energy consumption was assumed to remain a constant in proportion to the sum of the above three modes. It is recognised that this is a very crude assumption, however the remaining modes account for less than 5 % of the total final energy consumption in all recent years.


Document Actions
Share with others