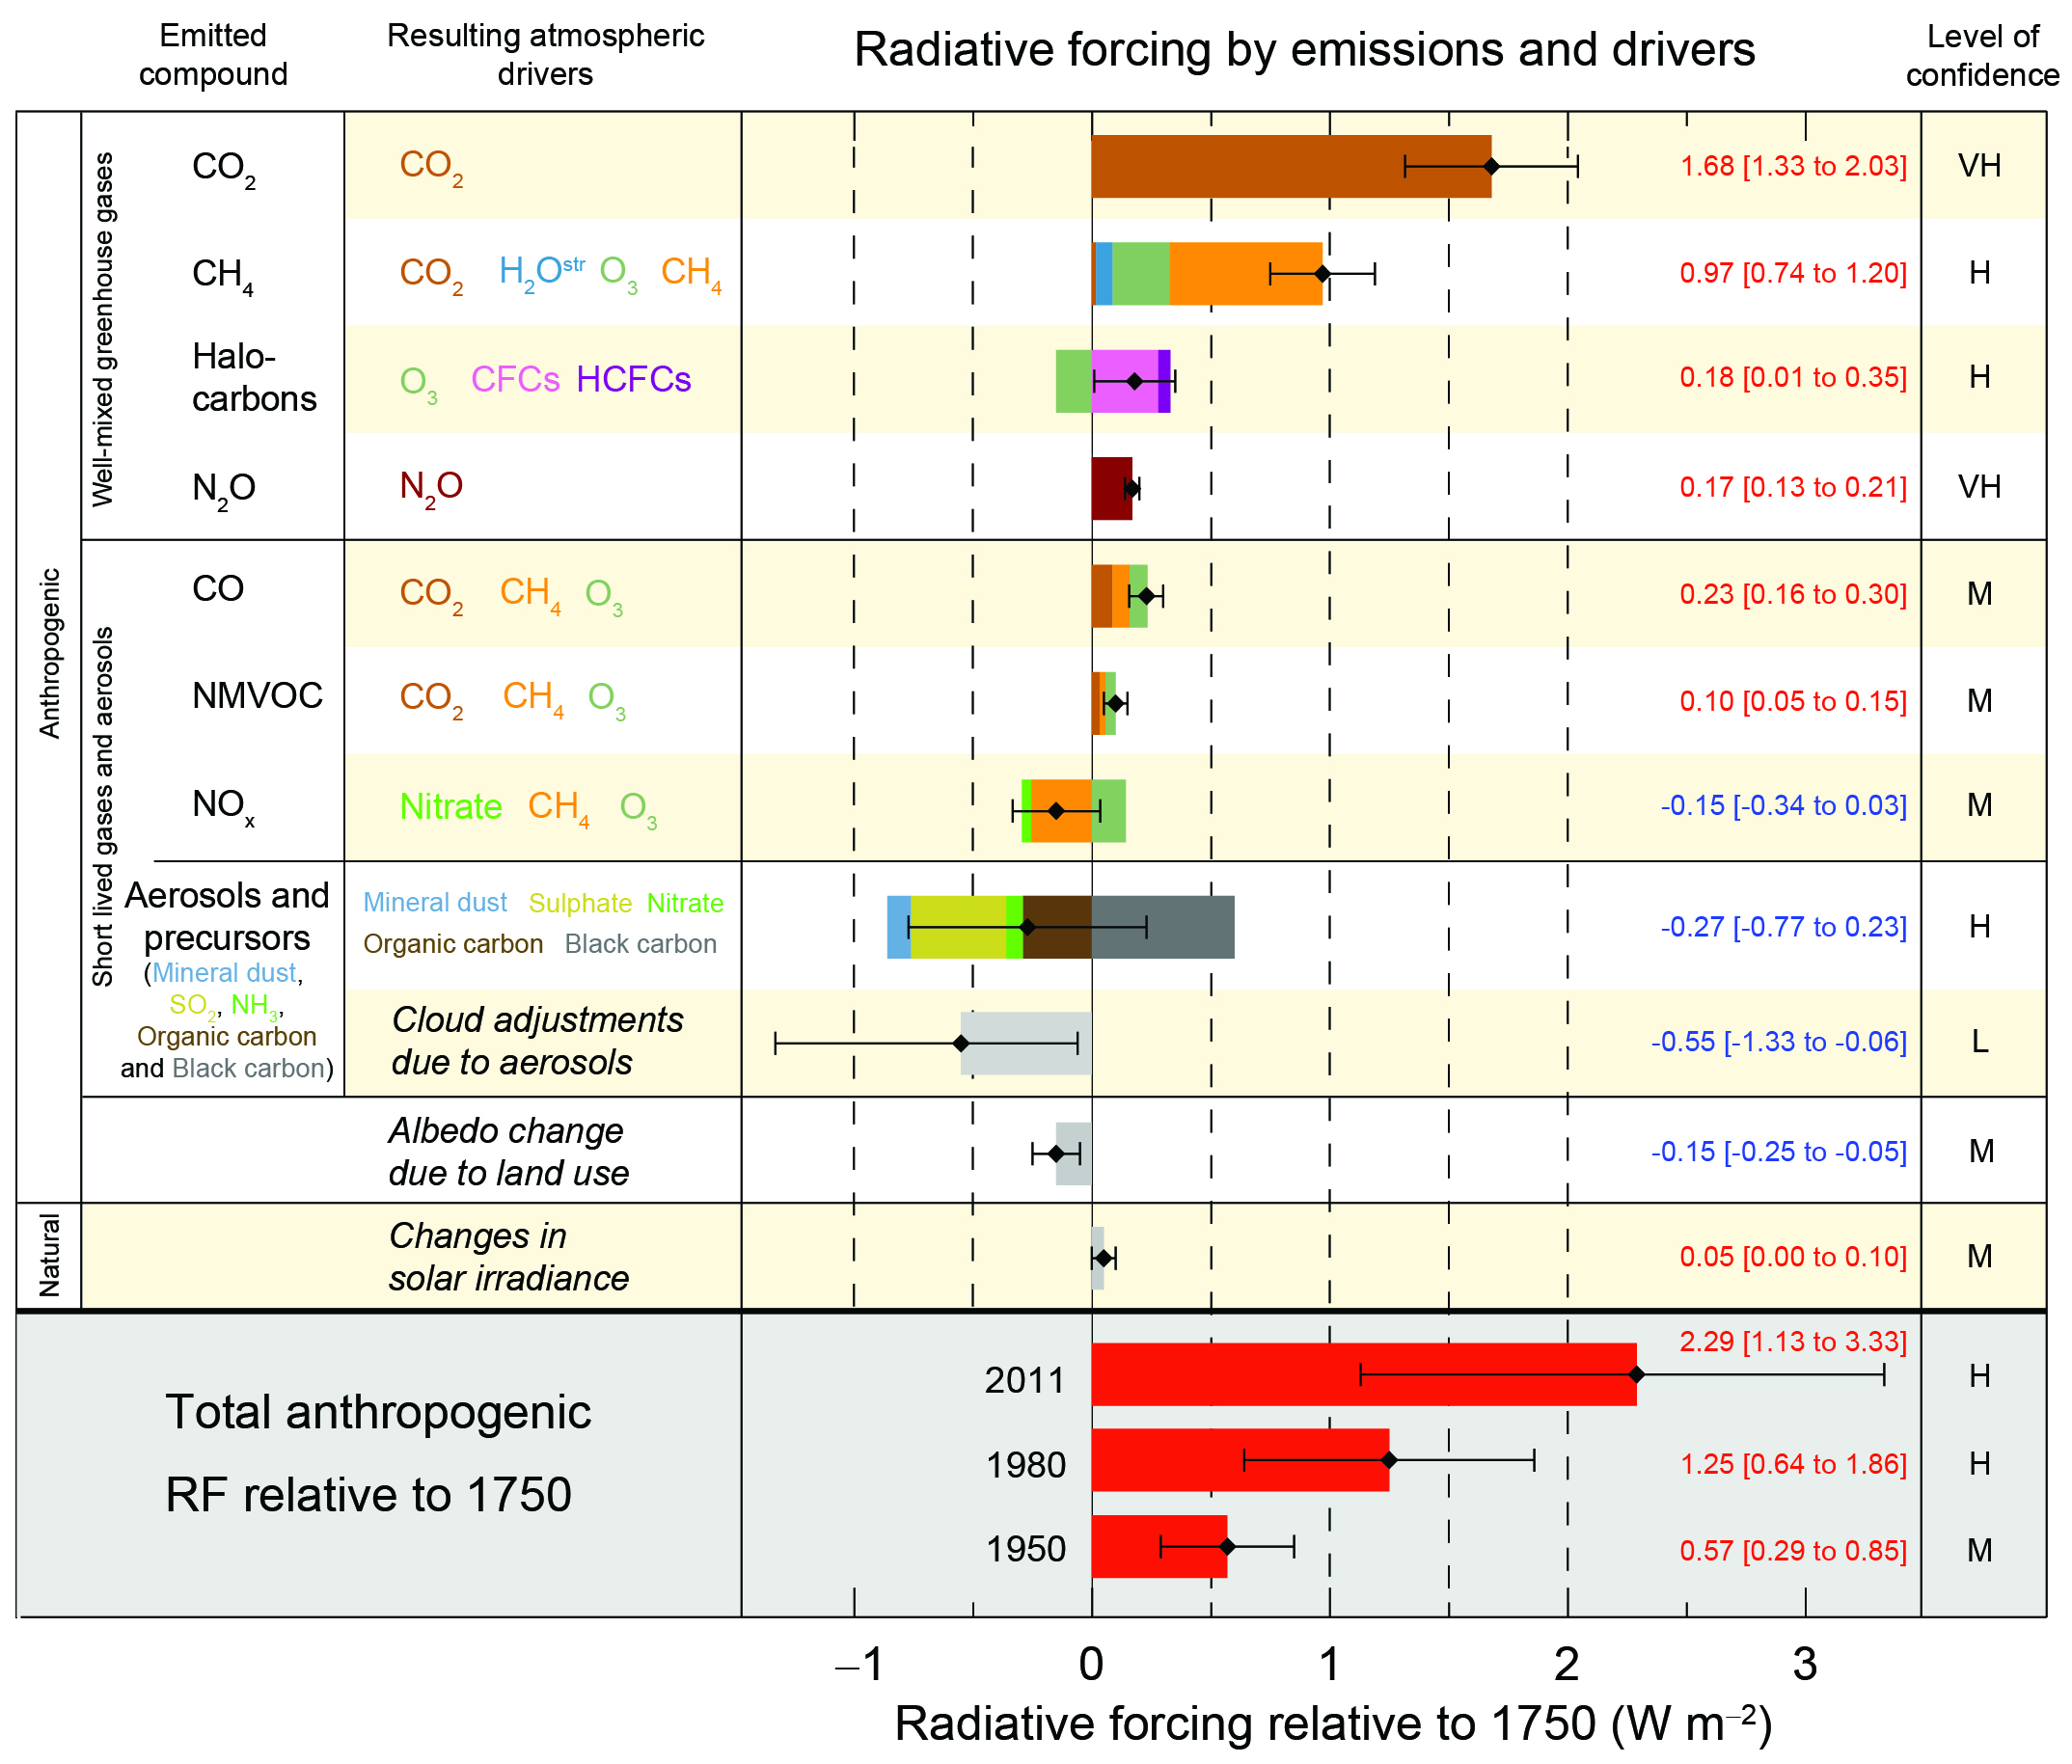
Values are global average radiative forcing (RF14), partitioned according to the emitted compounds or processes that result in a combination of drivers. The best estimates of the net radiative forcing are shown as black diamonds with corresponding uncertainty intervals; the numerical values are provided on the right of the figure, together with the confidence level in the net forcing (VH – very high, H – high, M – medium, L – low, VL – very low). Albedo forcing due to black carbon on snow and ice is included in the black carbon aerosol bar. Small forcings due to contrails (0.05 W m-2, including contrail induced cirrus), and HFCs, PFCs and SF6 (total 0.03 W m–2) are not shown. Concentration-based RFs for gases can be obtained by summing the like-coloured bars. Volcanic forcing is not included as its episodic nature makes is difficult to compare to other forcing mechanisms. Total anthropogenic radiative forcing is provided for three different years relative to 1750.
For further technical details, including uncertainty ranges associated with individual components and processes, see the Technical Summary Supplementary Material.
https://www.ipcc.ch/pdf/assessment-report/ar5/wg1/supplementary/WG1AR5_TSSM_FINAL.pdf
{8.5; Figures 8.14–8.18; Figures TS.6 and TS.7}


Document Actions
Share with others