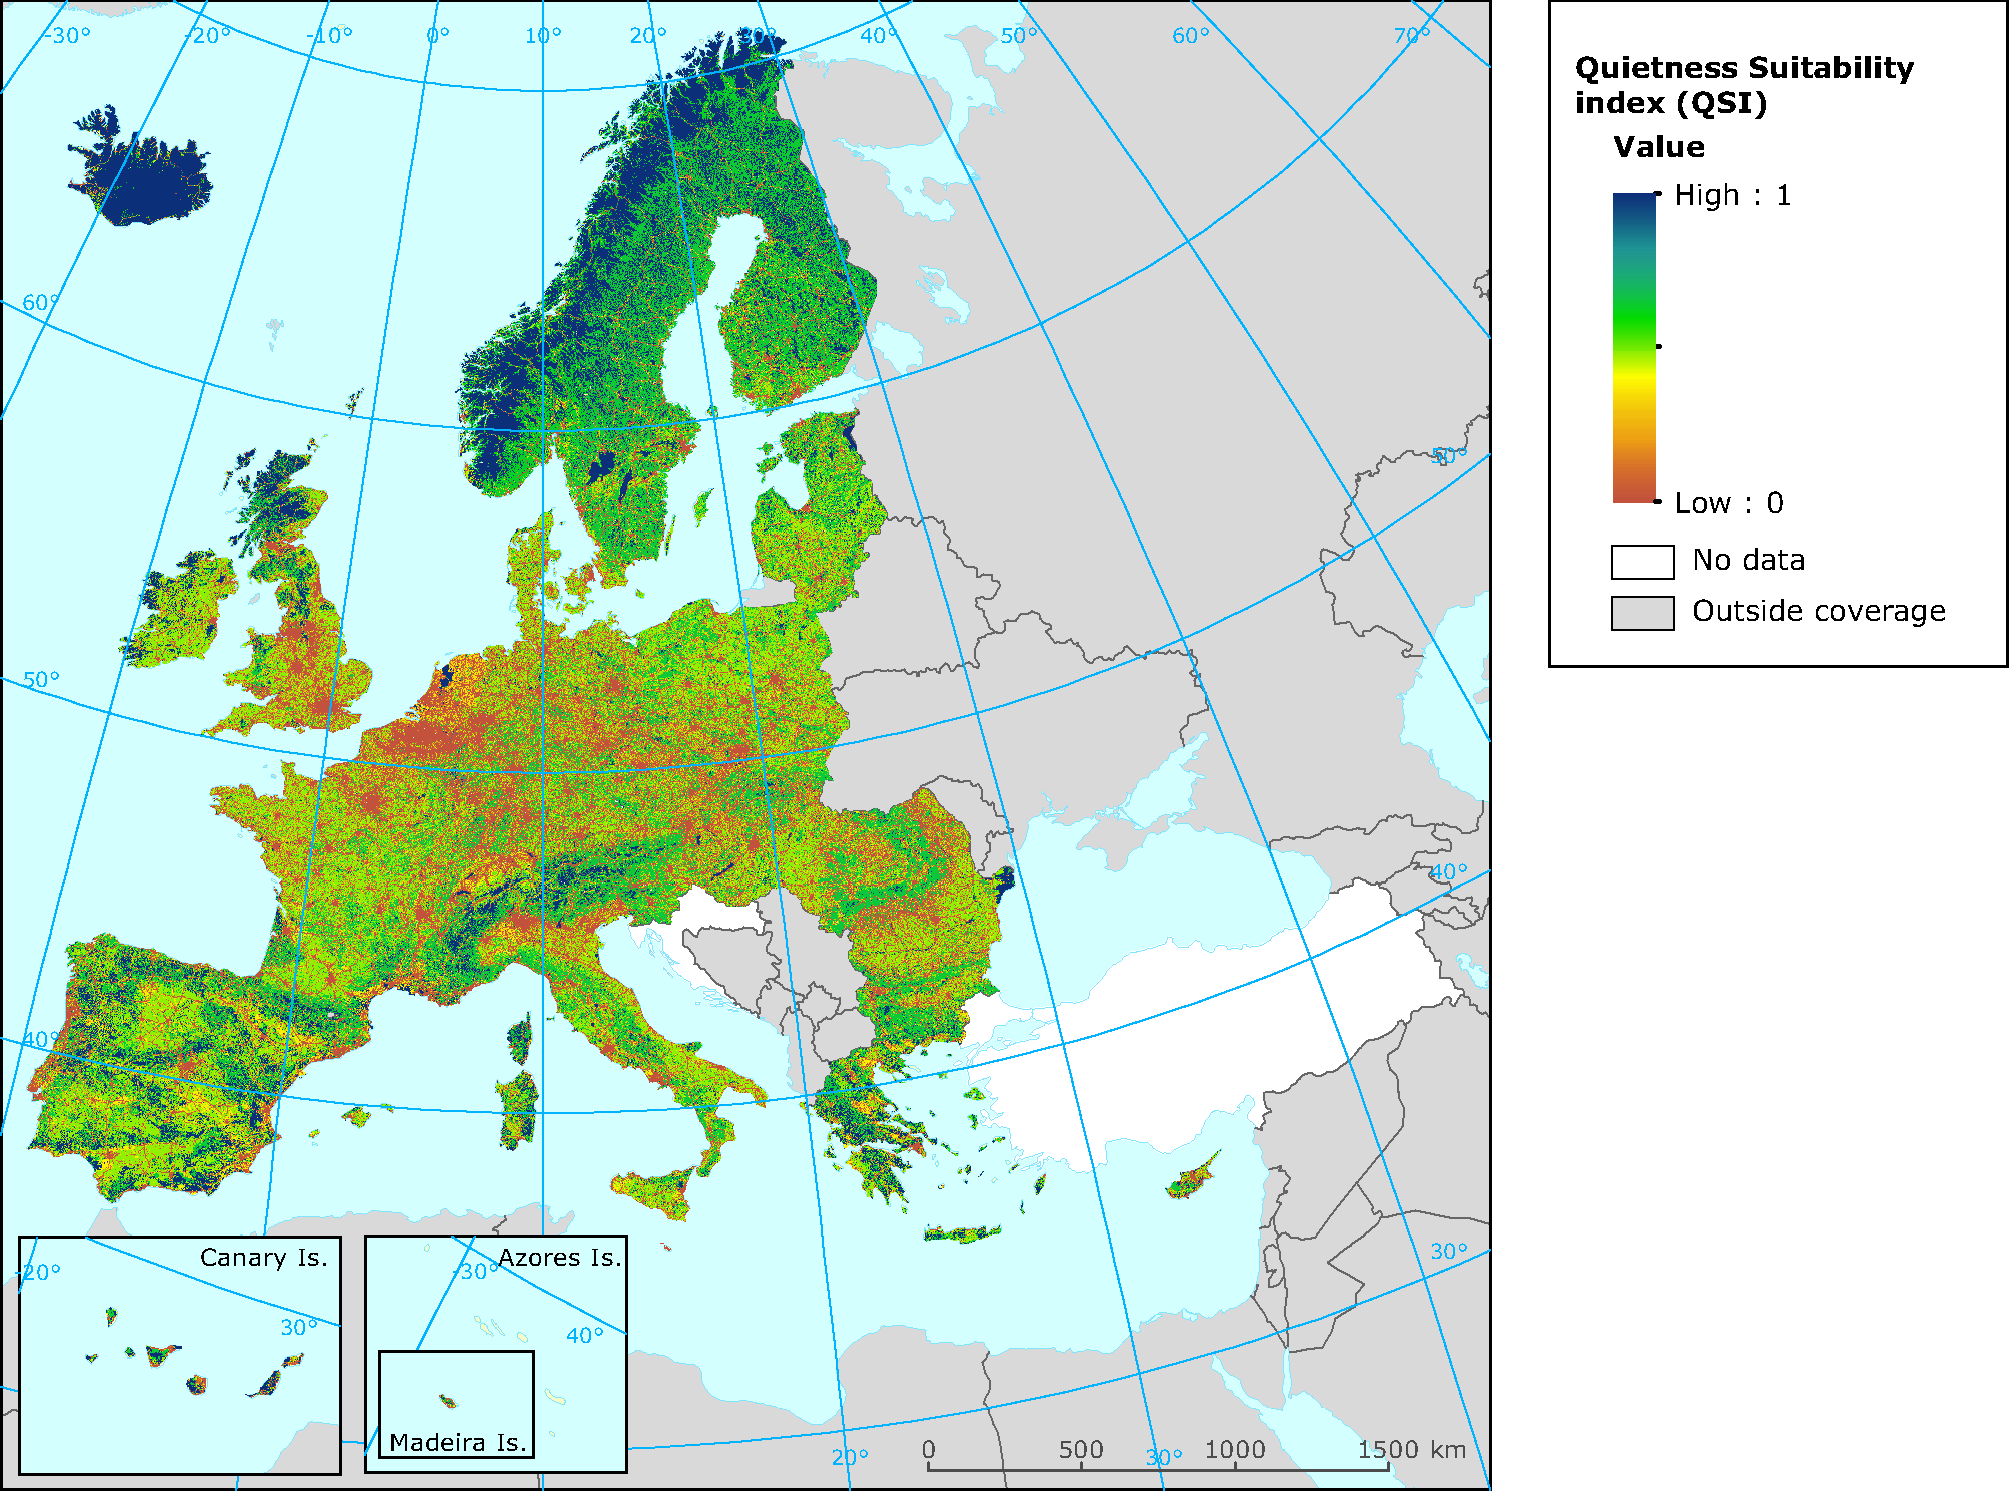
Suitable distance layer from noise sources built following a fuzzy approach (*), calculating the 'membership' to the quietness range (0–1) by means of a linear relationship, considering the mean value obtained as no suitable (= 0) and maximum distance obtained as suitable (= 1). The distance values between not suitable (mean value) and suitable (maximum value) will be reassigned with a new value between 0 and 1 following a linear equation.
(*) The production of threshold distance layers around noise sources has been made following a fuzzy approach rather than obtaining a buffer with sharp limits. Membership to a 0-1 range has been obtained according to a linear function.
Full methodology: Good practice guide on quiet areas.Technical report No 4/2014
http://www.eea.europa.eu/publications/good-practice-guide-on-quiet-areas


Document Actions
Share with others