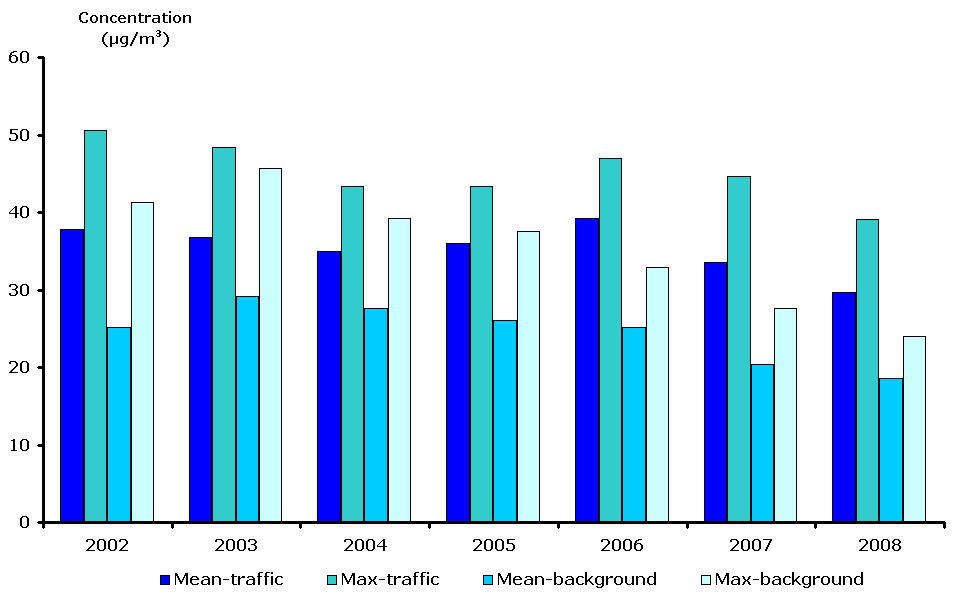
Since the available data (stations) vary from year to year and in order to ensure a consistent dataset only stations with complete data were chosen. For PM10 this resulted in complete data availability for 6 cities for the years 2002-2008. Meteorological data is not available, so meteorologically induced changes cannot be analysed. All stations for this analysis were selected according to their yearly data availability and their completeness as regards hourly data availability. For certain years and stations, the data availability was low, however these were used as no alternative was available. For further details on data availability issues, please see the indicator specification.


Document Actions
Share with others