All official European Union website addresses are in the europa.eu domain.
See all EU institutions and bodies
An official website of the European Union | How do you know?
Environmental information systems
EN

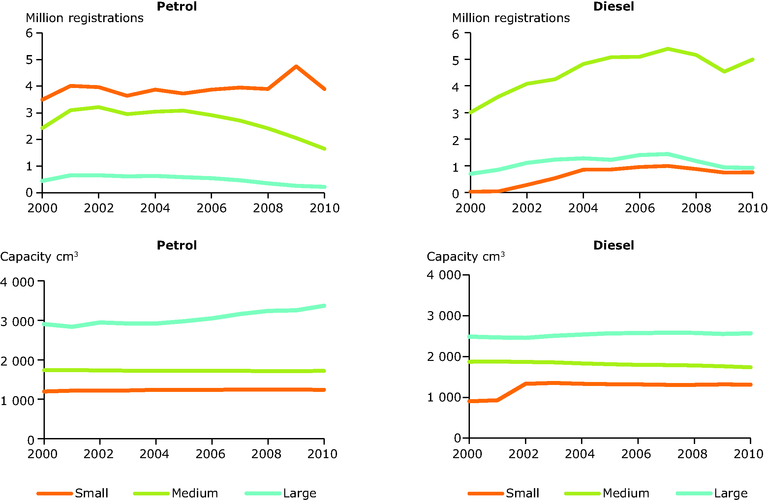
Graphs showing progression of the number of registrations and the capacity of the cars sold from 2000 to 2010.
Loading