The figure shows the emissions of acidifying pollutants (sulphur dioxide SO2, nitrogen oxides NOx and ammonia NH3) each weighted by an acid equivalency factor prior to aggregation to represent their respective acidification potentials. The acid equivalency factors are given by: w(SO2) = 2/64 acid eq/g = 31.25 acid eq/kg, w(NOx) = 1/46 acid eq/g = 21.74 acid eq/kg and w(NH3) = 1/17 acid eq/g = 58.82 acid eq/kg.
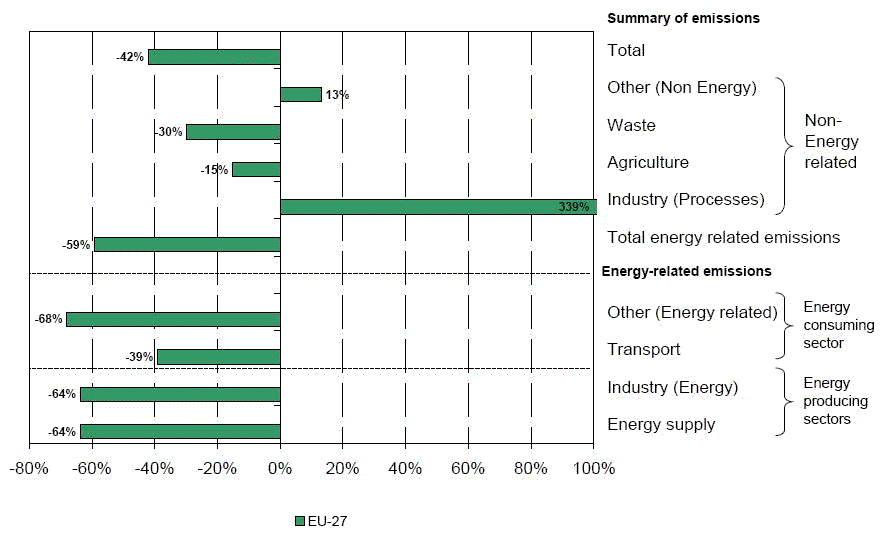
The energy supply sector includes public electricity and heat production, oil refining, production of solid fuels and fugitive emissions from fuels. The transport sector includes emissions from road and off-road sources (e.g. railways and vehicles used for agriculture and forestry). Industry (Energy) relates to emissions from combustion processes used in the manufacturing industry including boilers, gas turbines and stationary engines. 'Other (energy-related)' covers energy use mainly in the services and household sectors.


Document Actions
Share with others