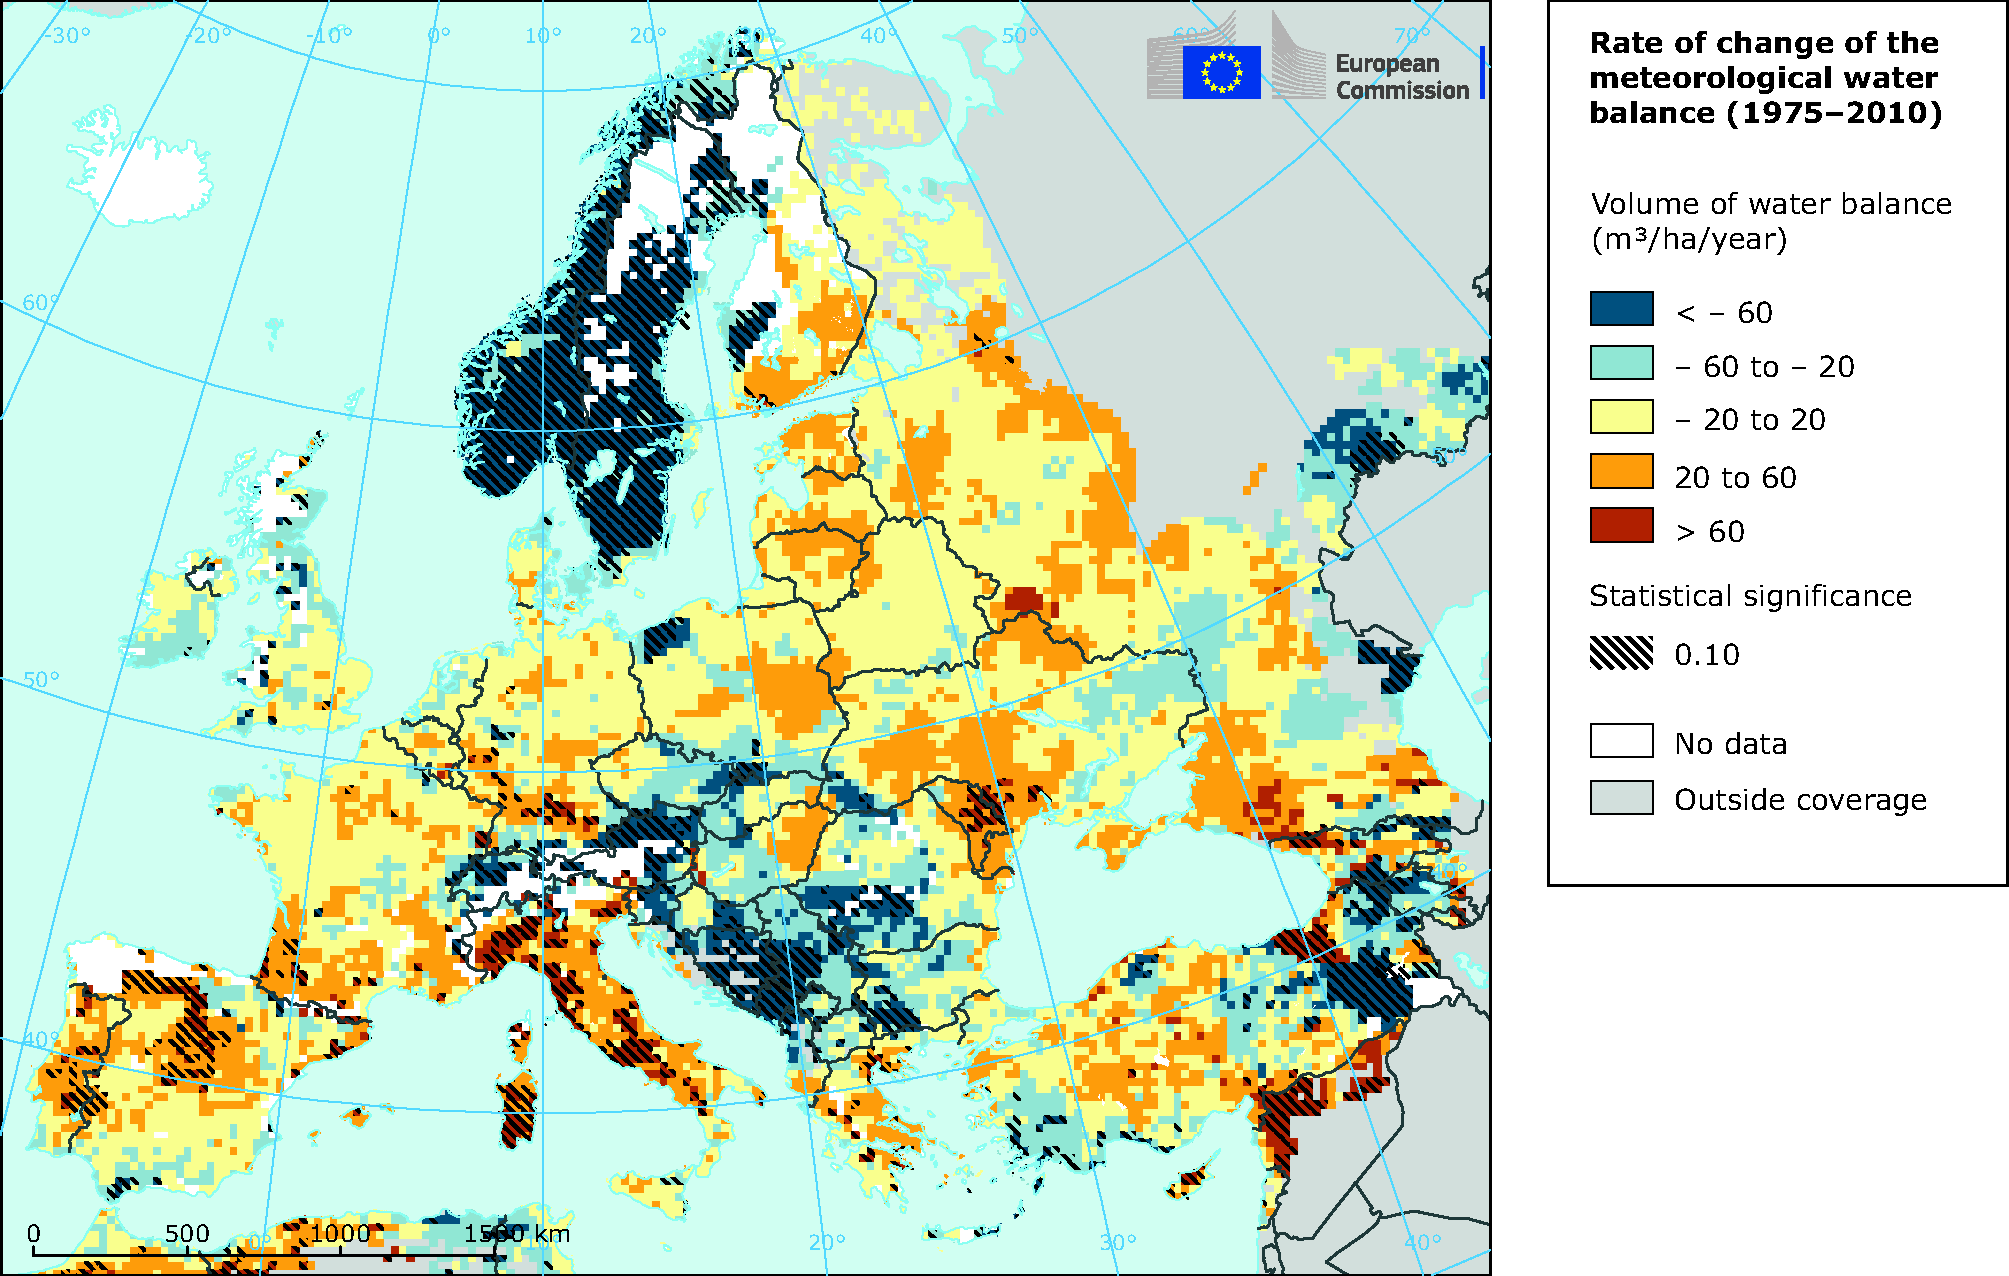
The map has been produced querying a database, internal to Joint Research Centre (JRC), containing meteo data at 25 kilometers grid level, interpolated from meteo station data. The interpolation is performed taking into account only arable land, potentially suitable for crop growth. The meteo data are provided to JRC in the frame of the MARSOP 3 contract, complying with Council Regulation (EC) No 78/2008 of 21 January 2008 on the measures to be undertaken by the Commission in 2008-2013 making use of the remote-sensing applications developed within the framework of the common agricultural policy, Official Journal of the European Union, L 25 of 30 January 2008, p. 1.


Document Actions
Share with others