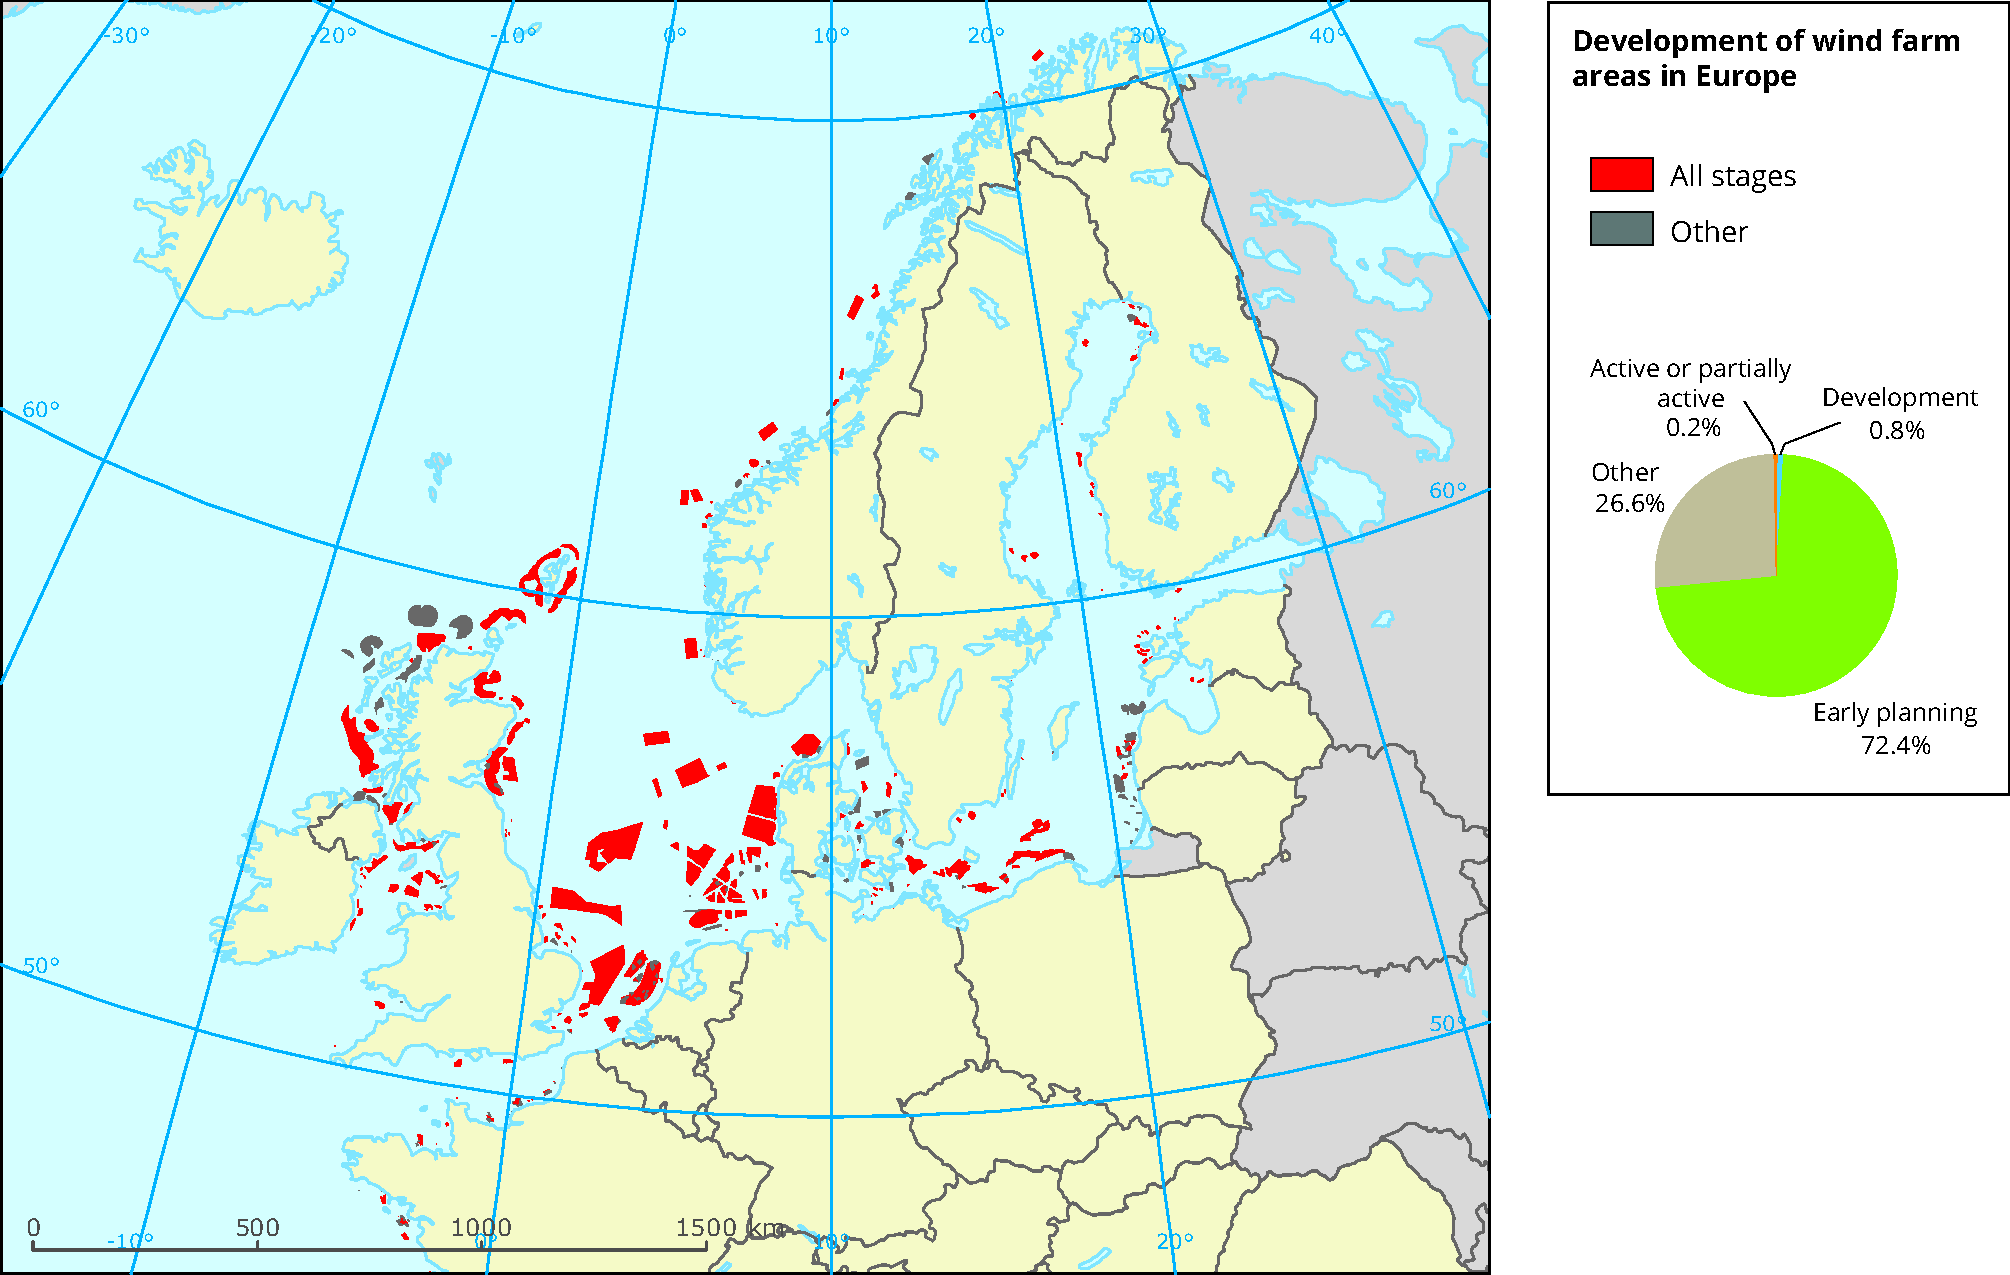
GDB; column names: 'Shape_Leng'´, Shape_Area', 'WindFarm_1' 'area_skm', which columns to join; column 'WindfarmSt' was reclassified: Active or partially active describes wind farms which are ‘generating power’ or ‘partial generation/under construction’; Development includes those which are considered to ‘have authorised consent’ or be ‘under construction’; and Early development includes those which were described as ‘concept, early planning’, ‘consent application submitted’ and ‘development zone’, Other includes ‘cancelled’, ‘decommissioned’, ‘dormant’ and ‘failed proposal’; column 'WindFarm_1' to use for the legend classification, changes: area calculated and expressed in square kilometers


Document Actions
Share with others